
|
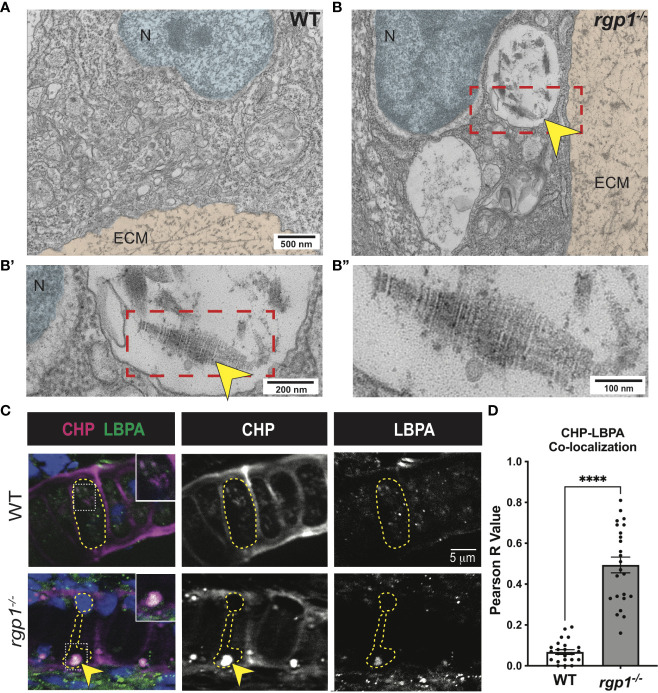
Figure 4
Collagen II accumulations in rgp1-/- chondrocytes localize to endolysosomes (A) TEM images of 3 dpf WT craniofacial chondrocytes. (B) TEM images of 3 dpf rgp1-/- craniofacial chondrocytes showing vacuolar structures (yellow arrowhead) (B’) Enlarged image of boxed area showing striated ultrastructure of intracellular collagen fibrils (yellow arrowhead). (B”) Further enlargement of boxed area. (C) Representative images of chondrocytes in WT and rgp1-/- cartilage (CHP, magenta; LBPA, green). Insets are enlargements of white dashed boxes, and an intracellular accumulation is labeled with a yellow arrowhead. (D) Quantification of the Pearson R value for co-localization in individual chondrocytes. Significance is presented by ****p<0.0001.