
- Title
-
Kinesin-5 Eg5 is essential for spindle assembly, chromosome stability and organogenesis in development
- Authors
- Yu, W.X., Li, Y.K., Xu, M.F., Xu, C.J., Chen, J., Wei, Y.L., She, Z.Y.
- Source
- Full text @ Cell Death Discov
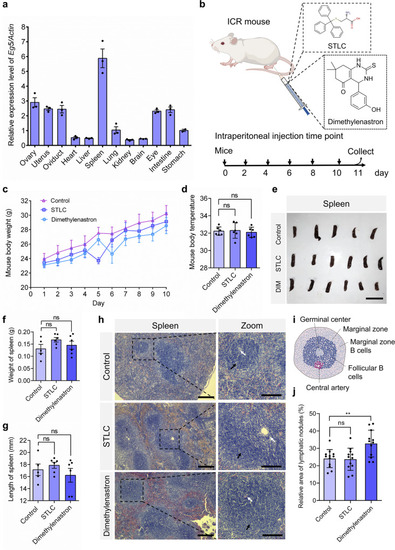
Eg5 inhibition led to the increase of lymphocytes in the spleen and the activation of immune responses in mouse models.
a Quantitative real-time PCR analysis of relative expression levels of the Eg5 gene in multiple organs, including the ovary, uterus, oviduct, heart, liver, spleen, lung, kidney, brain, eye, intestine, and stomach in mice. β-Actin served as the loading control. b The construction of Eg5 inhibition mouse models. The 4-week-old ICR mice were intraperitoneally injected with DMSO, STLC, and Dimethylenastron every two days for a total of five times, respectively. c Mouse body weight in the control, STLC, and Dimethylenastron groups were shown. The X-axis indicates the day after injection. The Y-axis indicated mouse body weights. d Mouse body temperature in the control, STLC, and Dimethylenastron groups. The Y-axis indicates the mouse’s body temperature (°C). e Representative images of mouse spleen in the control, STLC, and Dimethylenastron groups. Scale bar, 2 cm. f The weight of mouse spleen in the control, STLC, and Dimethylenastron groups. Control, 0.13 ± 0.02 g; STLC, 0.17 ± 0.01 g; Dimethylenastron, 0.15 ± 0.02 g. Control, N = 5; STLC, N = 6; DIM, N = 6. g The length of the spleen in the control, STLC, and Dimethylenastron groups. Control, 17.13 ± 0.96 mm; STLC, 17.87 ± 0.51 mm; Dimethylenastron, 16.21 ± 1.14 mm. Control, N = 5; STLC, N = 6; Dimethylenastron, N = 6. DIM indicates Dimethylenastron. h Representative HE staining of mouse spleen in the DMSO, STLC, and Dimethylenastron groups. The black arrow indicates the secondary lymphoid nodule, white arrow indicates the germinal center. Scale bar, 200 μm. In the zoom, scale bar, 100 μm. i The structure of the secondary lymphoid nodule and germinal center in mouse spleen. j Relative area of lymphatic nodules in the control, STLC, and Dimethylenastron groups. The lymphoid nodules with active immune responses can be divided into the dark zone and the light zone. Relative area (area of lymphatic nodule)/ (area of the spleen) in the spleen sections was measured using the Image J software. Control, 24.13 ± 1.50%, group = 12; STLC, 23.74 ± 1.84%, group = 12; Dimethylenastron, 32.76 ± 2.23%; group = 12. The group indicates the number of spleen tissues from at least 5 mice. For all graphs, mean ± SEM was shown. Student’s t test. ns, p > 0.05; **p < 0.01. |
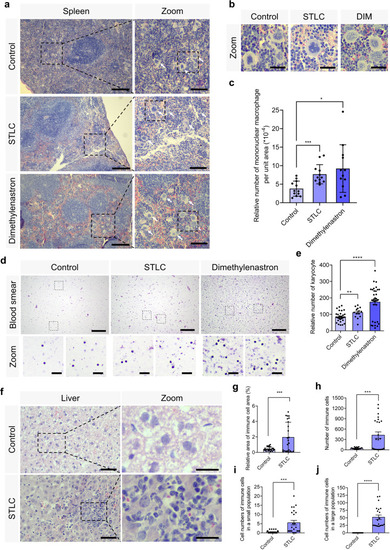
Eg5 inhibition resulted in the proliferation of monocytes in the spleen and the increase of karyocytes in the blood.
a Representative HE staining of mouse spleen in the control, STLC, and Dimethylenastron groups. Scale bar, 200 μm. In the zoom, scale bar, 100 μm. Arrows indicate the mononuclear macrophage. b The enlarged images of the mononuclear macrophage were shown. Scale bar, 30 μm. c The relative number of mononuclear macrophages per unit area (cell number of mononuclear macrophages/ the area of spleen section) in the spleen of the control, STLC, and Dimethylenastron groups. Control, 3.80 ± 0.59; STLC, 7.70 ± 0.75. Dimethylenastron, 9.22 ± 1.86. Control, group = 12; STLC, group = 12; Dimethylenastron, group = 12. The group indicates the number of spleen tissues from at least 5 mice. d Representative Giemsa staining of the karyocytes in the control, STLC, and Dimethylenastron groups. Scale bar, 200 μm. In the zoom, scale bar, 30 μm. Karyocytes consist of leukocytes, lymphocytes, monocytes, plasma cells, and macrophages. The number of karyocytes in a certain area (106 μm2) of blood smear was measured using the Image J software. e The relative number of karyocytes in the control, STLC, and Dimethylenastron groups. Control, 84.94 ± 4.99; STLC, 111.10 ± 8.60. Dimethylenastron, 174.60 ± 16.55. Control, group = 35; STLC, group = 14; Dimethylenastron, group = 33. f Representative images of mouse liver in the control, STLC, and Dimethylenastron groups. Scale bar, 50 μm. In the zoom, scale bar, 20 μm. g Relative area of immune cells (area of immune cells)/ (area of the liver cells). Control, 0.44 ± 0.05%; STLC, 1.98 ± 0.39%. Control, group = 25; STLC, group = 24. h The number of immune cells. Control, 43.68 ± 4.27; STLC, 425.60 ± 92.44. Control, group = 25; STLC, group = 24. i Cell numbers of immune cells in a small population. Control, 0.48 ± 0.15; STLC, 5.50 ± 1.24. Control, group = 25; STLC, group = 24. j Cell numbers of immune cells in a large population. Control, 0.00 ± 0.00; STLC, 51.95 ± 7.54. Control, group = 22; STLC, group = 21. The number of immune cells in a large population is defined as cell numbers of more than 20. The group indicates the number of tissues from at least 5 mice. For all graphs, mean ± SEM was shown. Student’s t test. *p < 0.05; **p < 0.01; ***p < 0.001; ****p < 0.0001. |
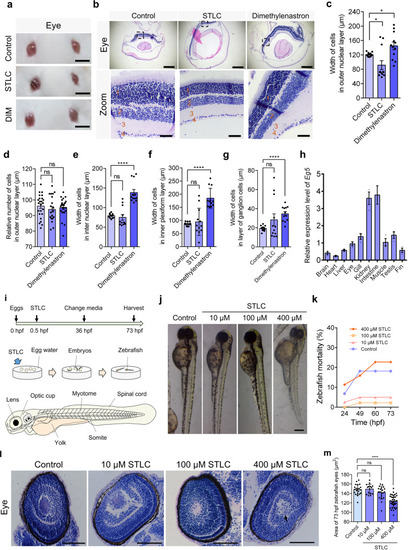
Eg5 was required for the development of the eye in mouse and zebrafish models.
a Representative images of the mouse eyes in the control, STLC, and Dimethylenastron groups. Scale bar, 5 mm. b Representative HE staining of mouse eye in the control, STLC, and Dimethylenastron groups. Scale bar, 200 μm. In the zoom, scale bar, 20 μm. Symbol 1 indicates the outer nuclear layer, 2 indicates the inter nuclear layer, 3 indicates the inner plexiform layer, and 4 indicates the layer of the ganglion cells. c The width of cells in the outer nuclear layer. Control, 120.80 ± 1.61 μm; STLC, 91.48 ± 12.38 μm; Dimethylenastron, 145.0 ± 10.60 μm. Group = 12. d The number of cells in the outer nuclear layer. Control, 96.08 ± 1.51; STLC, 93.95 ± 1.76; Dimethylenastron, 95.13 ± 1.27. Group = 6. e The width of cells in the inter nuclear layer. Control, 79.17 ± 1.66 μm; STLC, 75.00 ± 7.11 μm; Dimethylenastron, 138.40 ± 7.80 μm. f The width of cells in the inner plexiform layer. Control, 86.78 ± 2.12 μm; STLC, 94.68 ± 14.91 μm; Dimethylenastron, 184.60 ± 10.89 μm. Group = 12. g The width of cells in the layer of the ganglion cells. Control, 19.35 ± 0.80 μm; STLC, 28.33 ± 6.23 μm; Dimethylenastron, 34.59 ± 2.26 μm. h Quantitative real-time PCR analysis of expression levels of the Eg5 gene in zebrafish tissues, including the brain, heart, liver, eye, gill, kidney, muscle, testis, and fin. β-Actin served as the loading control. i The construction of the zebrafish model. STLC was added to the egg water at 0.5 hpf. The organs of zebrafish at 72 hpf were shown, including the lens, the optic cup, the myotome, the spinal cord, the somite, and the yolk. j Representative images of zebrafish at 73 hpf in the control and STLC groups. Scale bar, 0.2 mm. k The mortality of zebrafish in the control and STLC groups at 24, 49, 60 73 hpf. l Representative HE images of the eye in the zebrafish in the control, 10 μM STLC, and 100 μM STLC groups. Scale bar, 50 μm. m The area of 73 hpf zebrafish eyes (μm2) in the control and STLC groups. Mean ± SEM was shown. Student’s t test. ns, p > 0.05; *p < 0.05; ****p < 0.0001. EXPRESSION / LABELING:
PHENOTYPE:
|
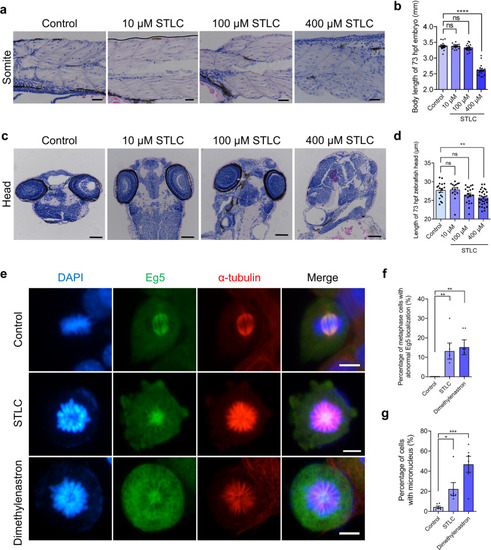
Eg5 is essential for cell division of somite cells and fibroblasts, and the development of head and somite.
a Representative HE images of the zebrafish somites at 73 hpf in the control, 10 μM STLC, and 100 μM STLC groups. Scale bar, 50 μm. b The body length of 73 hpf zebrafish embryos in the control, 10 μM STLC, and 100 μM STLC groups. c Representative HE images of the zebrafish head at 73 hpf in the control, 10 μM STLC, and 100 μM STLC groups. Scale bar, 100 μm. d The length of 73 hpf zebrafish heads in the control, 10 μM STLC, 100 μM STLC, and 400 μM STLC groups. e Representative immunofluorescence images of Eg5 and α-tubulin. DAPI, blue; Eg5, green; α-tubulin, red. NIH/3T3 cells were incubated with STLC and Dimethylenastron for 48 h. Scale bar, 10 μm. f The percentage of metaphase cells with abnormal Eg5 localization in the Control, STLC, and Dimethylenastron groups. Control, 0.00 ± 0.00%; 1 μM STLC, 13.20 ± 4.13%; 1 μM Dimethylenastron, 15.18 ± 3.79%. Groups = 6, N = 306, 56, 40. g The percentage of cells with micronucleus in the Control, STLC, and Dimethylenastron groups. Control, 4.27 ± 1.16%; 1 μM STLC, 22.24 ± 6.50%; 1 μM Dimethylenastron, 46.76 ± 7.91%. Groups = 6, N = 306, 67, 63. For all graphs, mean ± SEM was shown. Student’s t test. ns, p > 0.05; *p < 0.05; **p < 0.01; ***p < 0.001, ****p < 0.0001. PHENOTYPE:
|
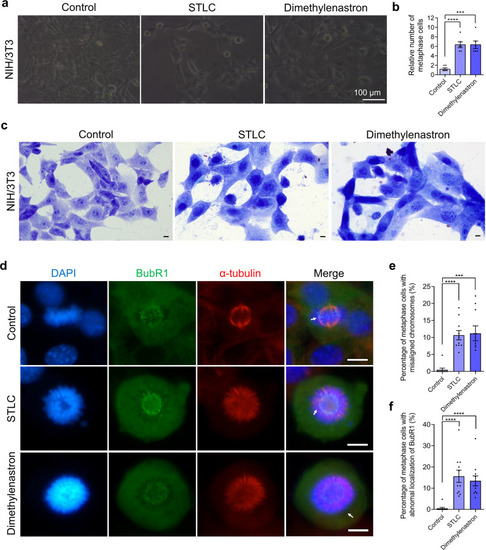
Eg5 inhibition resulted in abnormal localization of BubR1 and the formation of the monopolar spindle.
a Representative image of NIH/3T3 cells in the Control, 1 μM STLC, and 1 μM Dimethylenastron groups. Scale bar, 100 μm. NIH/3T3 cells were incubated with STLC and Dimethylenastron for 48 h. b The relative number of metaphase cells in the control, STLC, and Dimethylenastron. Control, 1.67 ± 0.31; 1 μM STLC, 6.33 ± 0.61; 1 μM Dimethylenastron, 6.33 ± 0.80. Groups = 6. c The Giemsa staining of NIH/3T3 cells after being treated with STLC and Dimethylenastron for 48 h. Scale bar, 10 μm. d Immunofluorescence images of BubR1 and α-tubulin in NIH/3T3 cells during metaphase. DAPI, blue; BubR1, green; α-tubulin, red. Scale bar, 10 μm. e The percentage of metaphase cells with misaligned chromosomes in the control, 1 μM STLC, and 1 μM Dimethylenastron groups. Control, 0.48 ± 0.48%; STLC, 10.68 ± 1.36%; Dimethylenastron, 11.20 ± 2.20%. Groups = 10. N = 352, 112, 131. f The percentage of metaphase cells abnormal localization of BubR1 in the control, STLC, and Dimethylenastron. Control, 0.48 ± 0.48%, Groups = 10, N = 352; STLC, 15.62 ± 2.87%, Groups = 11, N = 120; Dimethylenastron, 13.44 ± 2.35%, Groups = 11, N = 143. For all graphs, mean ± SEM was shown. Student’s t test. ***p < 0.001, ****p < 0.0001. |
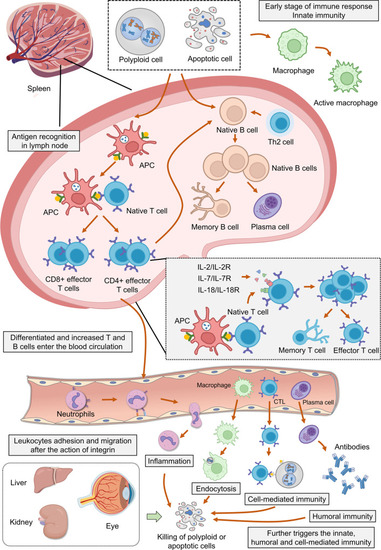
Schematic diagram of the immune response and developmental processes after Eg5 inhibition.
Eg5 inhibition results in the collapse of the bipolar spindle, metaphase arrest, and the activation of the spindle assembly checkpoint, which further leads to the increase of polyploid and apoptotic cells. First, the polyploid and apoptotic cells are recognized and phagocytosed by the macrophages during the innate immunity. Secondly, the polyploid and apoptotic cells stimulate the proliferation and differentiation of lymphoid T and B cells during adaptive immunity. This process is mediated by antigen-presenting cells (APCs) followed by the activation of T cells. In addition, IL-2, IL-7, and IL-18 also stimulate T cells to proliferate and differentiate into memory T cells and effector T cells. Moreover, B cells are also activated by Th2 cells and CD4+ cells to proliferate and differentiate into memory B cells and plasma cells. During blood circulation, the differentiated T and B cells, neutrophils, and cytotoxic T lymphocytes (CTLs) adhere, migrate and enter other organs to recognize and kill polyploid and apoptotic cells throughout the body. After Eg5 inhibition, the immune responses, including inflammation, endocytosis, cell-mediated immunity, and humoral immunity, occur in the organs with vigorous metabolism and cell division, such as the liver, kidney, and eyes. |

ZFIN is incorporating published figure images and captions as part of an ongoing project. Figures from some publications have not yet been curated, or are not available for display because of copyright restrictions. PHENOTYPE:
|