
|
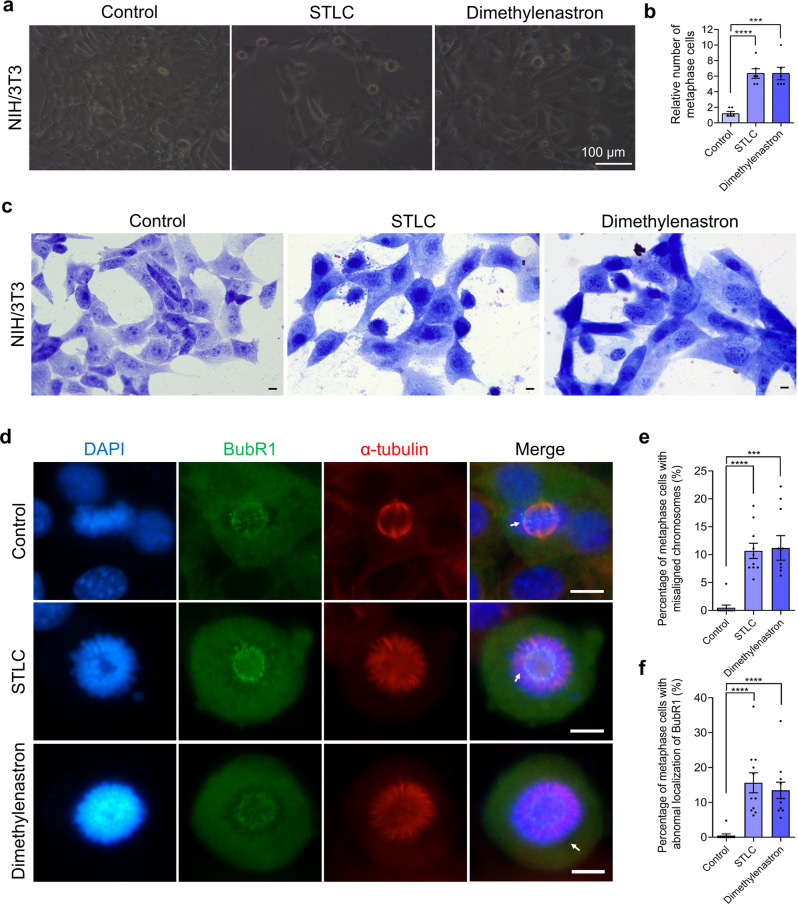
Fig. 5
a Representative image of NIH/3T3 cells in the Control, 1 μM STLC, and 1 μM Dimethylenastron groups. Scale bar, 100 μm. NIH/3T3 cells were incubated with STLC and Dimethylenastron for 48 h. b The relative number of metaphase cells in the control, STLC, and Dimethylenastron. Control, 1.67 ± 0.31; 1 μM STLC, 6.33 ± 0.61; 1 μM Dimethylenastron, 6.33 ± 0.80. Groups = 6. c The Giemsa staining of NIH/3T3 cells after being treated with STLC and Dimethylenastron for 48 h. Scale bar, 10 μm. d Immunofluorescence images of BubR1 and α-tubulin in NIH/3T3 cells during metaphase. DAPI, blue; BubR1, green; α-tubulin, red. Scale bar, 10 μm. e The percentage of metaphase cells with misaligned chromosomes in the control, 1 μM STLC, and 1 μM Dimethylenastron groups. Control, 0.48 ± 0.48%; STLC, 10.68 ± 1.36%; Dimethylenastron, 11.20 ± 2.20%. Groups = 10. N = 352, 112, 131. f The percentage of metaphase cells abnormal localization of BubR1 in the control, STLC, and Dimethylenastron. Control, 0.48 ± 0.48%, Groups = 10, N = 352; STLC, 15.62 ± 2.87%, Groups = 11, N = 120; Dimethylenastron, 13.44 ± 2.35%, Groups = 11, N = 143. For all graphs, mean ± SEM was shown. Student’s t test. ***p < 0.001, ****p < 0.0001.