
Fig. 3
- ID
- ZDB-FIG-230516-8
- Publication
- Yu et al., 2022 - Kinesin-5 Eg5 is essential for spindle assembly, chromosome stability and organogenesis in development
- Other Figures
- All Figure Page
- Back to All Figure Page
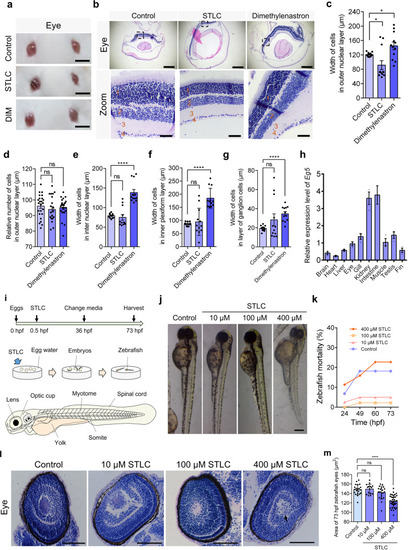
Eg5 was required for the development of the eye in mouse and zebrafish models.
a Representative images of the mouse eyes in the control, STLC, and Dimethylenastron groups. Scale bar, 5 mm. b Representative HE staining of mouse eye in the control, STLC, and Dimethylenastron groups. Scale bar, 200 μm. In the zoom, scale bar, 20 μm. Symbol 1 indicates the outer nuclear layer, 2 indicates the inter nuclear layer, 3 indicates the inner plexiform layer, and 4 indicates the layer of the ganglion cells. c The width of cells in the outer nuclear layer. Control, 120.80 ± 1.61 μm; STLC, 91.48 ± 12.38 μm; Dimethylenastron, 145.0 ± 10.60 μm. Group = 12. d The number of cells in the outer nuclear layer. Control, 96.08 ± 1.51; STLC, 93.95 ± 1.76; Dimethylenastron, 95.13 ± 1.27. Group = 6. e The width of cells in the inter nuclear layer. Control, 79.17 ± 1.66 μm; STLC, 75.00 ± 7.11 μm; Dimethylenastron, 138.40 ± 7.80 μm. f The width of cells in the inner plexiform layer. Control, 86.78 ± 2.12 μm; STLC, 94.68 ± 14.91 μm; Dimethylenastron, 184.60 ± 10.89 μm. Group = 12. g The width of cells in the layer of the ganglion cells. Control, 19.35 ± 0.80 μm; STLC, 28.33 ± 6.23 μm; Dimethylenastron, 34.59 ± 2.26 μm. h Quantitative real-time PCR analysis of expression levels of the Eg5 gene in zebrafish tissues, including the brain, heart, liver, eye, gill, kidney, muscle, testis, and fin. β-Actin served as the loading control. i The construction of the zebrafish model. STLC was added to the egg water at 0.5 hpf. The organs of zebrafish at 72 hpf were shown, including the lens, the optic cup, the myotome, the spinal cord, the somite, and the yolk. j Representative images of zebrafish at 73 hpf in the control and STLC groups. Scale bar, 0.2 mm. k The mortality of zebrafish in the control and STLC groups at 24, 49, 60 73 hpf. l Representative HE images of the eye in the zebrafish in the control, 10 μM STLC, and 100 μM STLC groups. Scale bar, 50 μm. m The area of 73 hpf zebrafish eyes (μm2) in the control and STLC groups. Mean ± SEM was shown. Student’s t test. ns, p > 0.05; *p < 0.05; ****p < 0.0001. |
| Gene: | |
|---|---|
| Fish: | |
| Anatomical Terms: | |
| Stage: | Adult |
| Fish: | |
|---|---|
| Condition: | |
| Observed In: | |
| Stage: | Protruding-mouth |