
Fig. 2
- ID
- ZDB-FIG-230516-7
- Publication
- Yu et al., 2022 - Kinesin-5 Eg5 is essential for spindle assembly, chromosome stability and organogenesis in development
- Other Figures
- All Figure Page
- Back to All Figure Page
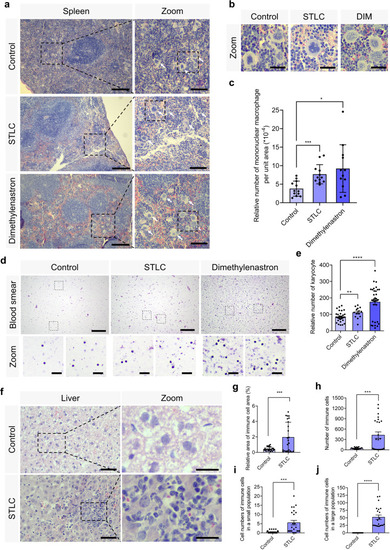
Eg5 inhibition resulted in the proliferation of monocytes in the spleen and the increase of karyocytes in the blood.
a Representative HE staining of mouse spleen in the control, STLC, and Dimethylenastron groups. Scale bar, 200 μm. In the zoom, scale bar, 100 μm. Arrows indicate the mononuclear macrophage. b The enlarged images of the mononuclear macrophage were shown. Scale bar, 30 μm. c The relative number of mononuclear macrophages per unit area (cell number of mononuclear macrophages/ the area of spleen section) in the spleen of the control, STLC, and Dimethylenastron groups. Control, 3.80 ± 0.59; STLC, 7.70 ± 0.75. Dimethylenastron, 9.22 ± 1.86. Control, group = 12; STLC, group = 12; Dimethylenastron, group = 12. The group indicates the number of spleen tissues from at least 5 mice. d Representative Giemsa staining of the karyocytes in the control, STLC, and Dimethylenastron groups. Scale bar, 200 μm. In the zoom, scale bar, 30 μm. Karyocytes consist of leukocytes, lymphocytes, monocytes, plasma cells, and macrophages. The number of karyocytes in a certain area (106 μm2) of blood smear was measured using the Image J software. e The relative number of karyocytes in the control, STLC, and Dimethylenastron groups. Control, 84.94 ± 4.99; STLC, 111.10 ± 8.60. Dimethylenastron, 174.60 ± 16.55. Control, group = 35; STLC, group = 14; Dimethylenastron, group = 33. f Representative images of mouse liver in the control, STLC, and Dimethylenastron groups. Scale bar, 50 μm. In the zoom, scale bar, 20 μm. g Relative area of immune cells (area of immune cells)/ (area of the liver cells). Control, 0.44 ± 0.05%; STLC, 1.98 ± 0.39%. Control, group = 25; STLC, group = 24. h The number of immune cells. Control, 43.68 ± 4.27; STLC, 425.60 ± 92.44. Control, group = 25; STLC, group = 24. i Cell numbers of immune cells in a small population. Control, 0.48 ± 0.15; STLC, 5.50 ± 1.24. Control, group = 25; STLC, group = 24. j Cell numbers of immune cells in a large population. Control, 0.00 ± 0.00; STLC, 51.95 ± 7.54. Control, group = 22; STLC, group = 21. The number of immune cells in a large population is defined as cell numbers of more than 20. The group indicates the number of tissues from at least 5 mice. For all graphs, mean ± SEM was shown. Student’s t test. *p < 0.05; **p < 0.01; ***p < 0.001; ****p < 0.0001. |