
Fig. 1
- ID
- ZDB-FIG-230516-6
- Publication
- Yu et al., 2022 - Kinesin-5 Eg5 is essential for spindle assembly, chromosome stability and organogenesis in development
- Other Figures
- All Figure Page
- Back to All Figure Page
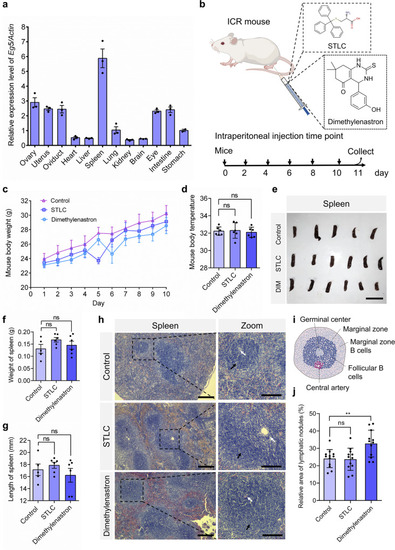
Eg5 inhibition led to the increase of lymphocytes in the spleen and the activation of immune responses in mouse models.
a Quantitative real-time PCR analysis of relative expression levels of the Eg5 gene in multiple organs, including the ovary, uterus, oviduct, heart, liver, spleen, lung, kidney, brain, eye, intestine, and stomach in mice. β-Actin served as the loading control. b The construction of Eg5 inhibition mouse models. The 4-week-old ICR mice were intraperitoneally injected with DMSO, STLC, and Dimethylenastron every two days for a total of five times, respectively. c Mouse body weight in the control, STLC, and Dimethylenastron groups were shown. The X-axis indicates the day after injection. The Y-axis indicated mouse body weights. d Mouse body temperature in the control, STLC, and Dimethylenastron groups. The Y-axis indicates the mouse’s body temperature (°C). e Representative images of mouse spleen in the control, STLC, and Dimethylenastron groups. Scale bar, 2 cm. f The weight of mouse spleen in the control, STLC, and Dimethylenastron groups. Control, 0.13 ± 0.02 g; STLC, 0.17 ± 0.01 g; Dimethylenastron, 0.15 ± 0.02 g. Control, N = 5; STLC, N = 6; DIM, N = 6. g The length of the spleen in the control, STLC, and Dimethylenastron groups. Control, 17.13 ± 0.96 mm; STLC, 17.87 ± 0.51 mm; Dimethylenastron, 16.21 ± 1.14 mm. Control, N = 5; STLC, N = 6; Dimethylenastron, N = 6. DIM indicates Dimethylenastron. h Representative HE staining of mouse spleen in the DMSO, STLC, and Dimethylenastron groups. The black arrow indicates the secondary lymphoid nodule, white arrow indicates the germinal center. Scale bar, 200 μm. In the zoom, scale bar, 100 μm. i The structure of the secondary lymphoid nodule and germinal center in mouse spleen. j Relative area of lymphatic nodules in the control, STLC, and Dimethylenastron groups. The lymphoid nodules with active immune responses can be divided into the dark zone and the light zone. Relative area (area of lymphatic nodule)/ (area of the spleen) in the spleen sections was measured using the Image J software. Control, 24.13 ± 1.50%, group = 12; STLC, 23.74 ± 1.84%, group = 12; Dimethylenastron, 32.76 ± 2.23%; group = 12. The group indicates the number of spleen tissues from at least 5 mice. For all graphs, mean ± SEM was shown. Student’s t test. ns, p > 0.05; **p < 0.01. |