
- Title
-
Blf and drl cluster synergistically regulate cell fate commitment during zebrafish primitive hematopoiesis
- Authors
- Zhang, X., Yang, Y., Wei, Y., Zhao, Q., Lou, X.
- Source
- Full text @ Development
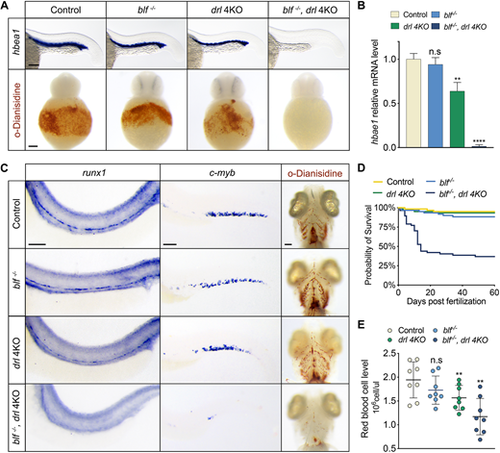
Simultaneous depletion of blf and the drl cluster leads to severe erythrocyte aplasia. (A) Top: RNA in situ hybridization of hbae1 expression in primitive erythrocytes of 23 hpf embryos. Bottom: Whole-mount o-dianisidine staining of 36 hpf embryos. (B) Relative expression levels of hbae1 in 23 hpf embryos. Data are mean±s.e.m. (C) Left: RNA in situ hybridization of runx1 expression in the dorsal aorta of 36 hpf embryos. Middle: RNA in situ hybridization of c-myb expression in the caudal hematopoietic tissue of 3 dpf embryos. Right: Whole-mount o-dianisidine staining of 7 dpf embryos; ventral views. (D) Representative Kaplan–Meier plot for wild-type, blf−/−, drl 4KO and blf−/−; drl 4KO fish from one of three independent experiments. Eighty animals of each genotype were followed. (E) Red blood cell levels in peripheral blood from adult fish; data are mean±s.e.m. Circles represent individual samples. In B and E, n.s, not significant, **P<0.01, ****P<0.0001. Scale bars: 100 μm. EXPRESSION / LABELING:
PHENOTYPE:
|
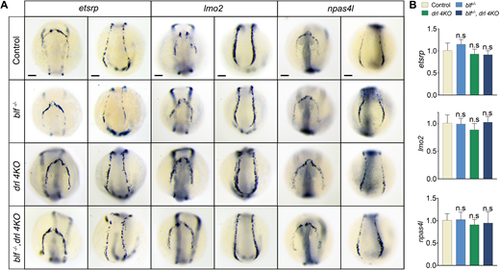
blf and drl cluster genes are dispensable for hemangioblast formation. (A) RNA in situ hybridization of etsrp, lmo2 and npas4l expression in 8-somite embryos. For etsrp WISH, n=28, 33, 36 or 32. For lmo2 WISH, n=37, 25, 32 or 29. For npas4l WISH, n=32, 29, 27 or 25. Listed sample sizes relate to each group shown from top to bottom. (B) qPCR results for expression of etsrp, lmo2 and npas4l in 8-somite embryos. Data are mean±s.e.m. of at least three replicates. n.s, not significant. Scale bars: 100 μm. EXPRESSION / LABELING:
|
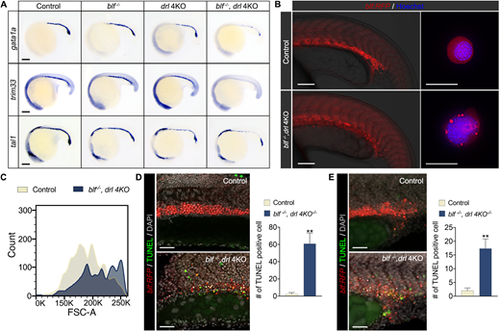
blf and drl cluster genes are essential for establishing the erythroid cell differentiation program. (A) RNA in situ hybridization of gata1a, trim33 and tal1 expression in 18-somite embryos. Lateral view with head to left. For gata1a WISH, n=37, 35, 33 or 36. For trim33 WISH, n=40, 38, 37 or 32. For tal1 WISH, n=31, 25, 40 or 37. Listed sample sizes relate to each group shown from top to bottom. Scale bars: 100 μm. (B) Fluorescence micrographs of control (blf+/−) and blf−/−; drl 4KO embryos and sorted RFP+ cells at 22 hpf. Scale bars: 200 μm (left); 10 μm (right). (C) Histograms of forward scatter showing approximate cell size distributions of the sorted RFP+ cells. (D,E) Left: Cell death in the intermediate cell mass (D) and in EMPs (E) assessed with TUNEL staining at 22 hpf. Scale bars: 100 μm. Right: Quantification of TUNEL-positive cells counted on a 100 μm×250 μm field for inner cell mass and 125 μm×125 μm field for EMPs. Data are mean±s.e.m. **P<0.01. Data were collected for 8-12 samples per experiment group. EXPRESSION / LABELING:
PHENOTYPE:
|
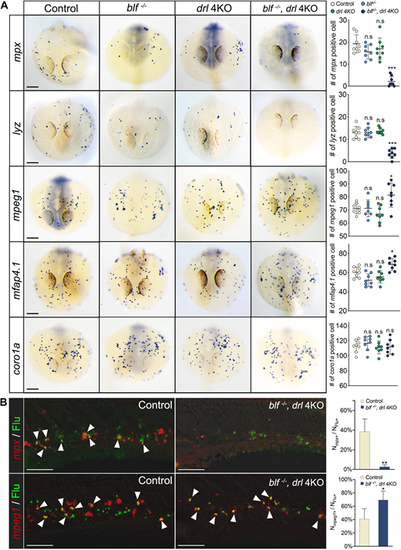
blf and the drl cluster regulate macrophage versus neutrophil fate choice during primitive myelopoiesis. (A) Left: RNA in situ hybridization of mpx, lyz, mpeg1, mfap4.1 and coro1a expression at 23 hpf. Right: The number of myeloid cells in different genotypes for each marker. Scale bars: 100 μm. (B) Left: Merged confocal images of the uncaged fluorescein and FISH signals in the trunk at 72 hpf. Scale bars: 50 μm. White arrowheads indicate the overlapping of fluorescein and FISH staining. Right: Quantification of fluorescein-labeled myeloid cells adopting the neutrophil or macrophage fate in control and blf−/−; drl 4KO embryos. Nmpx+, number of mpx-expressing cells; Nmpeg1+, number of mpeg1-expressing cells; NFlu+, number of fluorescein-labeled cells. Quantification was carried out on a 150 μm×275 μm field. Data were collected for 12-16 embryos per experiment group. n.s, not significant, *P<0.05, **P<0.01, ***P<0.001 (t-test). EXPRESSION / LABELING:
PHENOTYPE:
|
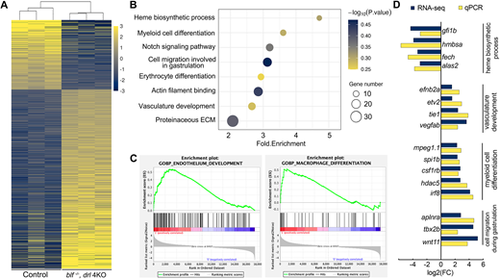
blf and the drl cluster play essential roles in establishing a normal transcription program during primitive erythropoiesis and myelopoiesis. (A) Heat map representation of genes differentially expressed in blf−/−; drl 4KO hematopoietic progenitors at 22 hpf. Yellow, upregulated; blue, downregulated; gray, no significant change. (B) Bubble plot showing GO enrichment of differentially expressed genes in blf−/−; drl 4KO hematopoietic progenitors. The size of the dots represents the number of differentially expressed genes in the corresponding biological process or molecular function. (C) Exemplary plots of significantly enriched pathways derived from GSEA. Criteria values for selection were enrichment score, family-wise error rate (P-value)<0.025 and FDR<0.05. (D) Comparison of changes in expression of selected genes measured by RNA-seq and qPCR. EXPRESSION / LABELING:
PHENOTYPE:
|
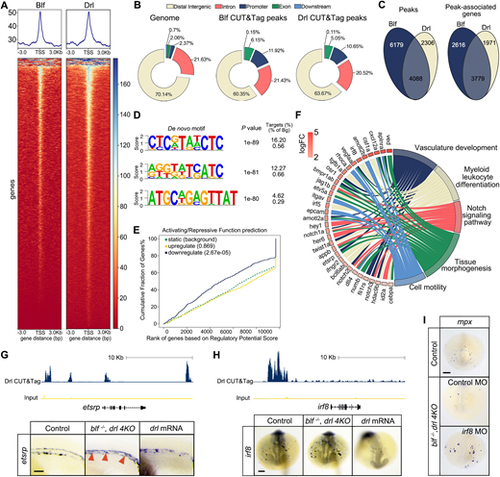
blf and drl cluster genes restrict the expression of vasculogenesis- and monocytopoiesis-promoting genes. (A) Read densities and signal distribution heatmap of Blf and Drl CUT&Tag sequencing at gene-coding regions, with 3 kb upstream and 3 kb downstream of transcription start site (TSS) shown. (B) Genome-wide distribution of Blf and Drl CUT&Tag sequencing peaks. Promoter regions are defined as sequences within 3 kb of the TSS of annotated genes. Downstream regions are defined as sequences within 3 kb of the gene end. (C) Quantitative Venn diagram showing overlapping peaks and peak-associate genes between Blf and Drl in hematopoietic progenitors at 20 hpf. (D) De novo motif prediction on Drl-binding sites was performed on CUT&Tag data using HOMER. The top three motifs are shown. (E) Activating and repressive function prediction of Drl in hematopoietic progenitors. BETA software was used with default parameters (peaks within ±100 kb of TSS) to integrate Drl CUT&Tag binding sites with expression data from the RNA-seq profile in hematopoietic progenitors from control and blf−/−; drl 4KO animals (n=3). The yellow, blue and green lines represent genes activated, repressed or unaffected by Drl, respectively. The percentage of genes is cumulated by the rank of genes based on their regulatory potential scores. P-values (in parentheses) were derived from Kolmogorov–Smirnov tests. (F) Circular plot of 33 representative Drl direct target genes, simultaneously presenting a detailed view of the relationships between expression changes (left semicircle perimeter) and processes (right semicircle perimeter). Color code represents the log2(fold change) value. (G) Top: Drl CUT&Tag binding profiles at the etsrp locus. Bottom: RNA in situ hybridization of etsrp expression in control (n=37), blf−/−; drl 4KO (n=36) and drl overexpressing (n=30) embryos at the 22-somite stage; lateral view. Red arrowheads indicate ectopic etsrp expression in the intermediate cell mass. (H) Top: Drl CUT&Tag binding profiles at the irf8 locus. Bottom: RNA in situ hybridization of irf8 expression in control (n=25), blf−/−; drl 4KO (n=37) and drl overexpression (n=36) embryos at the 22-somite stage; frontal view. (I) RNA in situ hybridization of mpx expression in control (n=34) and blf−/−; drl 4KO embryos injected with control (n=26) or irf8 morpholino (n=30). Samples were collected at the 22-somite stage and are displayed as frontal view. Scale bars: 100 μm. EXPRESSION / LABELING:
PHENOTYPE:
|
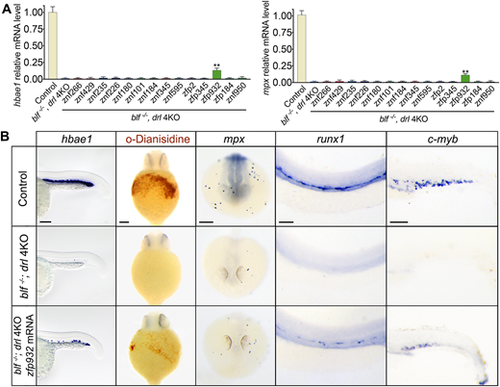
Zfp932 is a potential mammalian functional ortholog of the zebrafish blf and drl cluster genes. (A) qPCR of the erythroid marker gene hbae1 and the neutrophil marker gene mpx in blf−/−; drl 4KO embryos after injection of human or mouse mRNA. Data are mean±s.e.m. of at least three replicates. **P<0.01. (B) Left: Expression of hbae1 in 23 hpf embryos; n=27, 32 and 29 for each experimental set. Middle: Whole-mount o-dianisidine staining of 36 hpf embryos; n=31, 39 and 33 for each experimental set. Ventral views. Right three panels: RNA in situ hybridization of mpx, runx1 and c-myb expression. For mpx WISH, n=38, 33 and 25. For runx1 WISH, n=38, 29 and 30. For c-myb WISH, n=31, 25 and 37. Listed sample sizes relate to each group shown from top to bottom. Scale bars: 100 μm. EXPRESSION / LABELING:
PHENOTYPE:
|