
Fig. 5
|
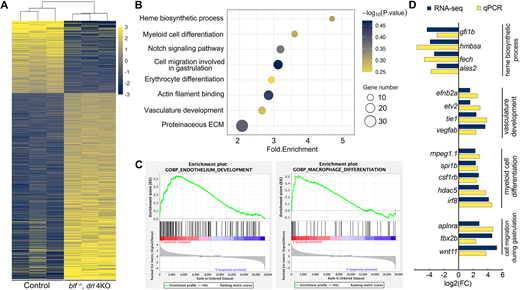
Fig. 5 blf and the drl cluster play essential roles in establishing a normal transcription program during primitive erythropoiesis and myelopoiesis. (A) Heat map representation of genes differentially expressed in blf−/−; drl 4KO hematopoietic progenitors at 22 hpf. Yellow, upregulated; blue, downregulated; gray, no significant change. (B) Bubble plot showing GO enrichment of differentially expressed genes in blf−/−; drl 4KO hematopoietic progenitors. The size of the dots represents the number of differentially expressed genes in the corresponding biological process or molecular function. (C) Exemplary plots of significantly enriched pathways derived from GSEA. Criteria values for selection were enrichment score, family-wise error rate (P-value)<0.025 and FDR<0.05. (D) Comparison of changes in expression of selected genes measured by RNA-seq and qPCR.