
- Title
-
Genetic therapy in a mitochondrial disease model suggests a critical role for liver dysfunction in mortality
- Authors
- Sabharwal, A., Wishman, M.D., Cervera, R.L., Serres, M.R., Anderson, J.L., Holmberg, S.R., Kar, B., Treichel, A.J., Ichino, N., Liu, W., Yang, J., Ding, Y., Deng, Y., Lacey, J.M., Laxen, W.J., Loken, P.R., Oglesbee, D., Farber, S.A., Clark, K.J., Xu, X., Ekker, S.C.
- Source
- Full text @ Elife
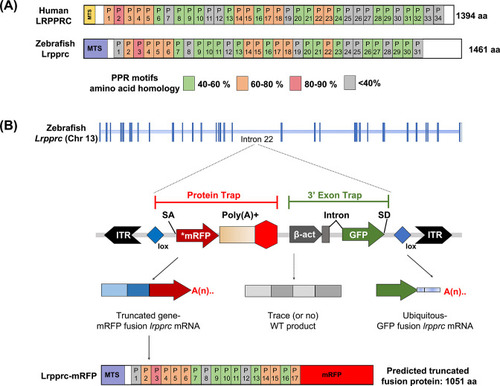
GBT mutagenesis generates a novel zebrafish model of LSFC.(A) Schematic of human and zebrafish LRPPRC proteins with highlighted PPR domains (denoted by P). (B) Schematic of the integration event of GBT vector RP2.1 with 5’ protein trap and 3’ exon trap cassettes. The RP2.1 cassette was integrated into the intronic region 22 of the lrpprc genomic locus on chromosome 13. ITR, inverted terminal repeat; SA, loxP; Cre recombinase recognition sequence, splice acceptor; *mRFP’ AUG-less mRFP sequence; poly (A) +, polyadenylation signal; red-octagon, extra transcriptional terminator and putative border element; β-act, carp beta-actin enhancer, SD, splice donor. |
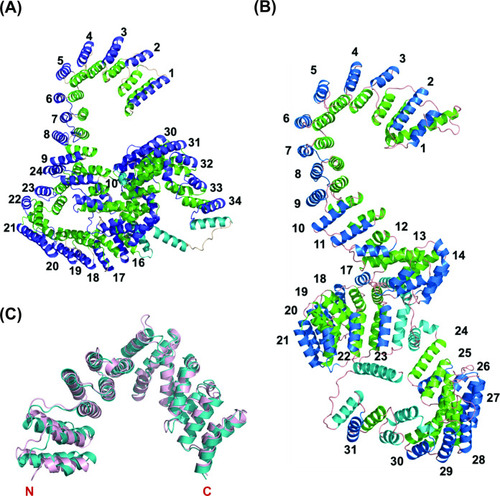
Overall predicted structure of human and zebrafish LRPPRC and its C-terminus comparison with human LRPPRC.(A) The predicted structure of mature human LRPPRC comprises 34 likely PPR repeats. (B) Overall predicted structure of mature zebrafish Lrpprc comprises 31 likely PPR repeats. The two helices within each repeat are colored green and blue. The predicted PPR motifs are numbered from the N-terminal of the protein. The functionally undefined regions and C-terminal helix were colored cyan. (C) Structural superimposition of the C-terminus part (SEC1 domain) of human and zebrafish Lrpprc. The light pink and teal colors represent human and zebrafish Lrpprc respectively. |
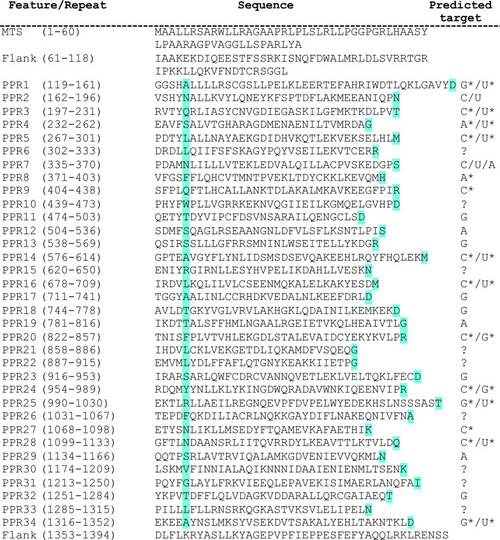
Domain organization of human LRPPRC predicted from structural and sequence analysis.Structure-based prediction of PPR motifs. PPR sequences and comprehensive residues are represented on the left. The cyan color highlighted amino acids specify the RNA binding of PPR motifs. The predicted target ribonucleotides for each motif are presented on the right. The targets with and without the star marks are high confidence and speculative predictions, respectively. We put the corresponding question mark sign where the prediction for the PPR motif was not sure. |
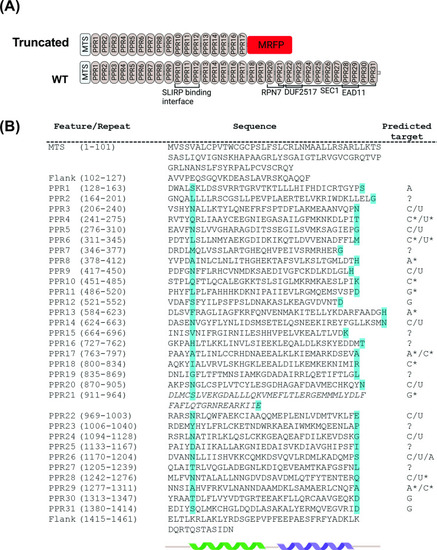
Domain organization of zebrafish Lrpprc predicted from structural and sequence analysis.(A) Schematic representation of the PPR motifs and sequence homology domain structure of zebrafish Lrpprc. The homology domains are predicted by comparing the zebrafish Lrpprc sequence against multiple databases. The structural analysis predicted that in GBT0235 mutants, truncated Lrpprc had the insertion of mRFP towards the end of PPR motif 17. (B) Structure-based prediction of PPR motifs. PPR sequences and comprehensive residues are represented on the left. The cyan color highlighted amino acids specify the RNA binding of PPR motifs. The predicted target ribonucleotides for each motif are presented on the right. The targets with and without the star marks are high confidence and speculative predictions, respectively. We put the corresponding question mark sign where the prediction for the PPR motif was not sure. The italicized motif was highly degenerate and may consist of a pair of PPRs. |
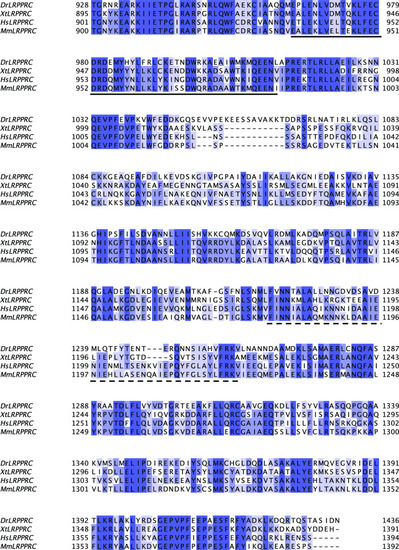
Sequence alignment of SEC1 domain of LRPPRC from different model organisms.Sequence conservation was represented with a Percentage Identity color code (percentage abundance of aligned residues in each column). Species abbreviations used: Dr-Danio rerio, Xt-Xenopus tropicalis, Hs-Homo sapiens, and Mm-Mus musculus. The DUF2517 and EAD11 homology domains were underlined by solid and dotted lines, respectively. |
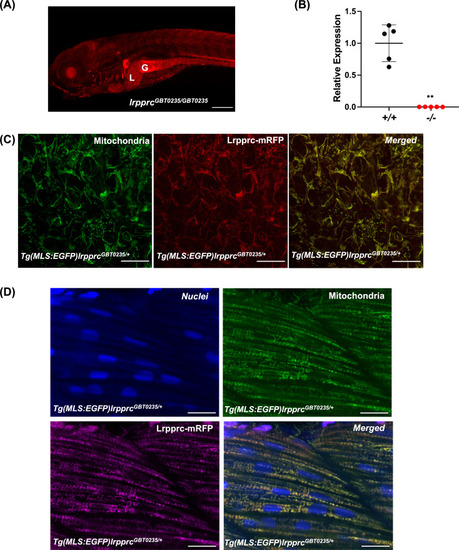
Spatiotemporal expression of Lrpprc-mRFP in GBT0235 mutants.(A) Representative images of 6 dpf lrpprcGBT0235/GBT0235 with RFP expression in the liver and gut (magnification-5×; scale-bar: 200 µm). (B) Relative expression of lrpprc transcript in lrpprc+/+ and homozygous mutant larvae, lrpprc-/- (P-value = 0.0015). p-value was determined using the unpaired t-test. Each data point represents a biological replicate (N=5) (Figure 3—source data 1). (C) Mitochondrial network marked by EGFP in the caudal fin was observed to be overlapping with truncated Lrpprc:mRFP fusion protein in 2 dpf Tg(MLS:EGFP)lrpprcGBT0235/+ embryo (scale bar: 15 µm). (D) RFP from truncated Lrpprc:mRFP fusion protein was observed to be overlapped with EGFP in mitochondria present in myocytes of skeletal muscle region in 2 dpf Tg(MLS:EGFP)lrpprcGBT0235/+ embryo injected with NLS:TagBFP RNA. Nuclei were marked by TagBFP protein (scale-bar: 15 µm). |
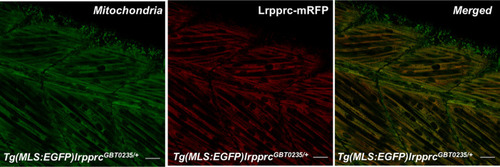
Lrpprc-mRFP localizes to the mitochondria in the zebrafish mutants.4 dpf Tg(MLS:EGFP)lrpprcGBT0235/+ was used to observe the subcellular localization of the Lrpprc-mRFP protein in the myocytes from the skeletal muscle region (magnification 63×; scale bar: 20 µm). |
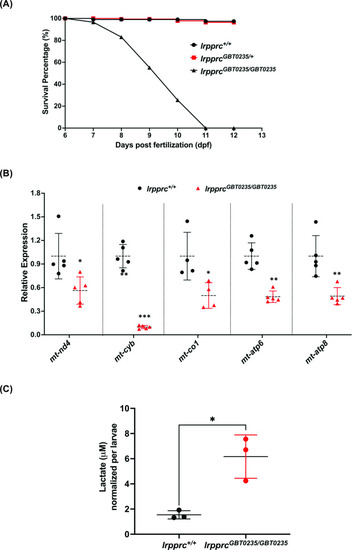
rpprcGBT0235/GBT0235 mutants recapitulate the hallmarks of LSFC. (A) Survival percentage of lrpprc+/+, lrpprcGBT0235/+, and lrpprcGBT0235/GBT0235. Data is represented from independent experiments (N=5 pairs) (Figure 4—source data 1) (B) Relative expression of mtDNA transcripts in the lrpprcGBT0235/GBT0235 and lrpprc+/+ assessed by qRT-PCR. Mitochondrial transcripts were normalized to eef1a1l1 transcript levels. The black circle represents wild-type and the red triangle represents homozygous mutants. Each data point represents embryos from the different clutch. Error bars are represented as SD (*: p-value < 0.05, **: p-value < 0.01, ***: p-value < 0.001). p-Values were determined by unpaired t-test. p-values (mt-nd4=0.0248; mt-cyb=0.0001; mt-co1=0.0371; mt-atp6=0.0011; mt-atp8=0.0089). (Figure 4—source data 1) (C) Relative lactate levels in the whole-body lysates of wild-type and lrpprc homozygous siblings. Lactate levels were normalized to the number of larvae. Error bars are represented as SD (*: p-value = 0.0392). p-Value was determined using the unpaired t-test. (Figure 4—source data 1). |
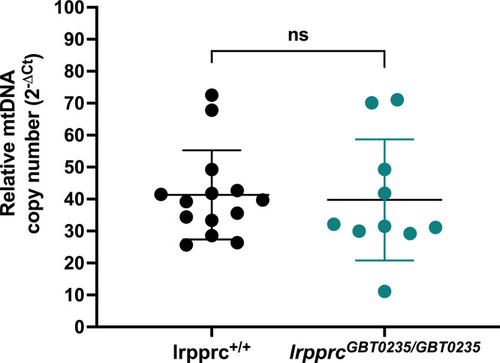
Relative mtDNA copy number in lrpprc homozygous mutants: No significant change was observed in the homozygous mutants as compared to wild-type siblings (lrpprc+/+ vs lrpprcGBT0235/GBT0235; p-value = 0.8263). Each data point represents a genotyped individual animal. mt-nd1 and polg were used as mitochondrial and nuclear control respectively. p-Value was estimated by the unpaired t-test. Error bars represent the standard deviation (Figure 4—source data 1). |
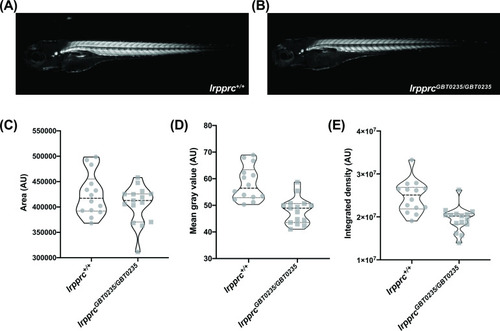
lrpprcGBT0235/GBT0235 mutants display decreased birefringence. (A–B) Representative Birefringence images of lrpprc+/+ (A) and lrpprcGBT0235/GBT0235 mutants (B). (C–E) The images and graphs in the figure show the birefringence area of the region of interest (ROI) (C), mean gray value (D), and integrated density (E) between lrpprc+/+ and lrpprcGBT0235/GBT0235 mutants. lrpprcGBT0235/GBT0235 mutants display similar birefringence area (p-value = 0.4773) but a decrease in mean gray value (p-value < 0.0001) and integrated density (p-value = 0.0001). Each individual data point represents a single embryo (For lrpprc+/+; N=14 and lrpprcGBT0235/GBT0235; N=15). Each parental pair represents a biological replicate. p-Values were determined using the Mann-Whitney test. (Figure 5—source data 1) (magnification- 5×). PHENOTYPE:
|
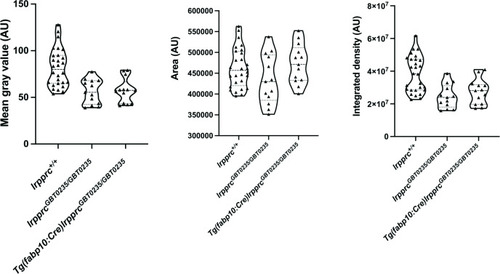
lrpprcGBT0235/GBT0235 and Tg(fabp10:Cre)lrpprcGBT0235/GBT0235 mutants display decreased birefringence at 4 dpf. Graphs displaying the birefringence area of the region of interest (ROI), mean gray value, and integrated density between lrpprc+/+, lrpprcGBT0235/GBT0235, and Tg(fabp10:Cre)lrpprcGBT0235/GBT0235 mutants at 4 dpf. lrpprcGBT0235/GBT0235 mutants display a decrease in mean gray value (p-value = 0.0003) and integrated density (p-value = 0.0002) as compared to wild type, whereas no significant difference in the birefringence area is observed (p-value = 0.1280). Tg(fabp10:Cre)lrpprcGBT0235/GBT0235 mutants do not display significant difference in the birefringence area (p-value = 0.1254), mean gray value (p-value = 0.7623) and integrated density (p-value = 0.3622) as compared to lrpprcGBT0235/GBT0235 mutants. Each individual data point represents a single animal (For lrpprc+/+; N=28, lrpprcGBT0235/GBT0235; N=13 and Tg(fabp10:Cre)lrpprcGBT0235/GBT0235; N=13). p-Values were determined using the Mann-Whitney test. (Figure 5—source data 1). |
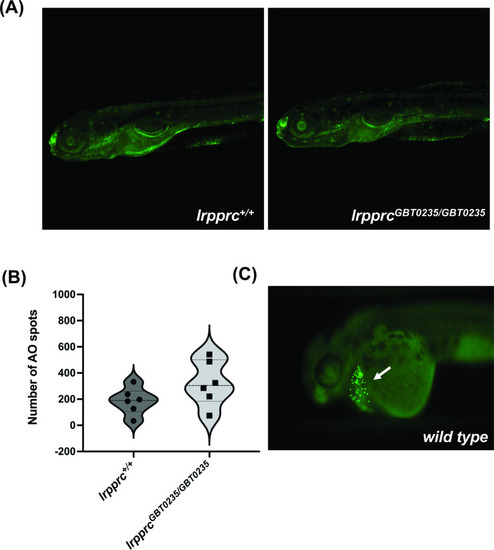
lrpprc homozygous mutants do not display neuronal necrosis. (A) Representative images of 6 dpf wild-type and lrpprcGBT0235/GBT0235 mutants. Background neuronal necrosis was observed in the wild type as well as lrpprc homozygous siblings (magnification- 5×). (B) Individual spots were quantified in the neuronal region of interest across a series of images (blinded images) obtained from both genotypes and the number of such particle counts was not significant (p-value = 0.1797). Each individual data point represents a single embryo. p-Values were determined using the Mann-Whitney U test. (C) Hatching gland displaying programmed apoptosis during organogenesis at 2 dpf zebrafish embryo (Positive control for the AO assay; Figure 5—source data 1). |
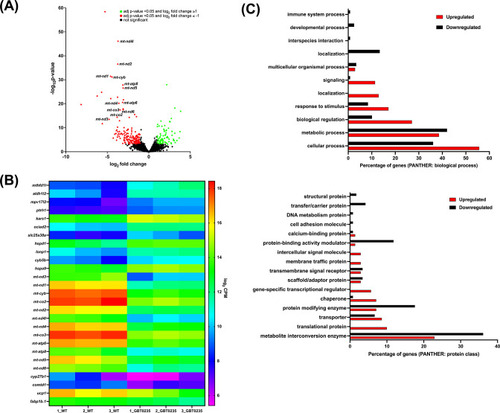
RNAseq of lrpprcGBT0235/GBT0235 homozygous mutants. (A) Volcano plot of differentially expressed genes in the homozygous mutants. log2 of fold change and minus of log10 of p-value is represented on the x-axis and y-axis, respectively. The red dots signify the significantly downregulated genes and the green dots represent the significantly upregulated genes between the 6 dpf lrpprcGBT0235/GBT0235 and lrpprc+/+ larvae. Non-significant genes are represented by black dots (B) Heat map visualization of expression of zebrafish orthologs for human Mitocarta genes. The gradient color scale represents the log2CPM value obtained for each of the zebrafish mitochondrial orthologs across the biological replicates for each genotype. (C) PANTHER classification for all the significantly differentially expressed genes in the homozygous mutant according to protein class and biological process. Each histogram represents the percentage of genes having hits in the PANTHER database that fall in each of the categories, that is, biological process, and protein class. |
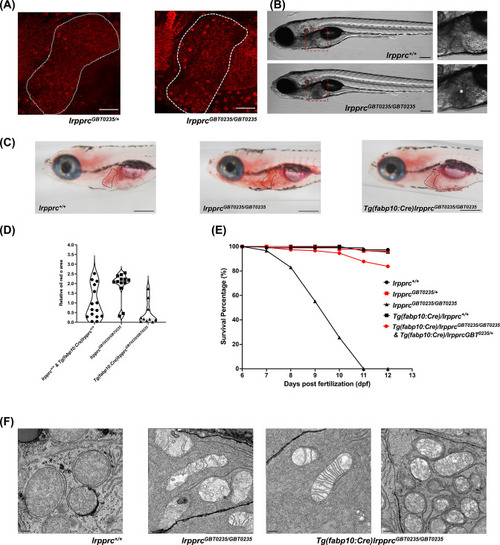
The liver plays an important role in the pathology of LSFC and genetic liver-specific rescue rescues the lipid defect and mortality in lrpprc homozygous mutant larvae. (A) Representative images of the livers of 6 dpf old lrpprcGBT0235/+and lrpprcGBT0235/GBT0235 mutants at 40× (scale bar: 50 µm). (B) Brightfield image of 6 dpf lrpprc+/+ and lrpprcGBT0235/GBT0235 mutants. Homozygous mutants display a dark liver phenotype as compared to the wild-type controls. The region showing dark liver has been marked by an asterisk (scale bar: 150 µm). (C) Oil red O staining for assessment of lipid accumulation in the 6 dpf mutants and rescued larvae. Increased lipid accumulation was observed in the homozygous mutants compared to wild-type larvae. In the liver-specific rescued homozygous lrpprc mutants, Tg(fabp10:Cre)lrpprcGBT0235/GBT0235, no accumulation of lipids was observed (scale bar: 200 µm). (D) The graph show increase in the relative area of the oil red stain for the accumulated lipids, between wild-types (non-rescued wild-type, lrpprc+/+ and liver-specific rescued wild-type Tg(fabp10:Cre)lrpprc+/+) and lrpprcGBT0235/GBT0235 mutants, indicating an increase in the lipid content (p-value = 0.0083). The levels are restored in homozygous rescued larvae, Tg(fabp10:Cre)lrpprcGBT0235/GBT0235 (p-value < 0.0001). There was no significant difference between wild-types (non-rescued wild-type, lrpprc+/+ and liver-specific rescued wild-type Tg(fabp10:Cre)lrpprc+/+) and liver-specific rescued mutants, Tg(fabp10:Cre)lrpprcGBT0235/GBT0235 (p-value = 0.0623). p-Values were determined by the Mann-Whitney test. Each data point represents a single embryo. For, lrpprc+/+ N = 8; Tg(fabp10:Cre)lrpprc+/+ N = 7; lrpprcGBT0235/GBT0235 N=13; Tg(fabp10:Cre)lrpprcGBT0235/GBT0235, N=10. (Figure 7—source data 1) (E) Liver-specific rescued mutants display an improved survival rate beyond 11 dpf (Figure 7—source data 1). (F) Representative electron micrographs of the mitochondria in hepatocytes for 8 dpf lrpprc wild type, lrpprc homozygous mutants, and liver-specific lrpprc rescued larvae. Altered mitochondrial morphology displayed by lrpprcGBT0235/GBT0235 was observed to be improved in the rescued mutants, Tg(fabp10:Cre)lrpprcGBT0235/GBT0235 (scale bar: 0.5 µm). |
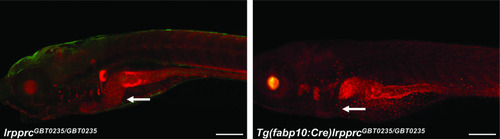
Irreversible liver-specific Cre recombinase-mediated rescue.lrpprcGBT0235/+ adult zebrafish were crossed with Tg(−2.8fabp10:Cre;−0.8cryaa:Venus)S955 to obtain double transgenic adult zebrafish expressing both the GBT cassette and the fabp10 driven Cre recombinase. Tg(fabp10:Cre)lrpprcGBT0235/GBT0235 zebrafish larvae demonstrate a loss of RFP expression in the liver contributed by the reversion of mutagenicity RFP cassette mediated via liver-specific Cre recombinase (magnification- 5×; scale bar: 200 µm). |
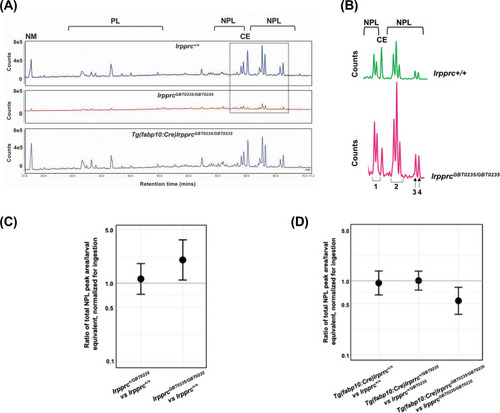
Genetic liver-specific rescue of altered dietary lipid metabolism in lrpprc homozygous mutant larvae. (A) Representative chromatographs are shown: lipid extractions from whole wild-type larvae (top) and whole lrpprc homozygous mutant larvae (middle). Peaks represent different lipid species and are quantified by peak area. Liver-specific rescue of lrpprcGBT0235/GBT0235 mutants restores nonpolar lipid levels to wild-type levels in liver-specific rescued homozygous mutant larvae (bottom). All peaks were normalized to the amount of non-metabolizable fluorescent reagent ingested (NM). (B) Excerpts from representative chromatographs, wild-type larvae (top), and lrpprc homozygous mutant larvae (bottom). Peaks or peak areas (labeled as 1–4) were individually analyzed for contribution to the overall higher NPL level in lrpprc homozygous mutants compared to their wild-type siblings. (C) 95% CI plot: lrpprcGBT0235/GBT0235 generated 2.04 times more non-polar lipids compared to their wild-type siblings (lrpprcGBT0235/GBT0235/lrpprc+/+=2.040, p-value = 0.019). p-Value was obtained from the standard normal z-table. (D) 95% CI plot: Tg(fabp10:Cre)lrpprcGBT0235/GBT0235 restored the levels of non polar lipids as compared to lrpprcGBT0235/GBT0235 homozygous mutants. PL = phospholipids; NPL = nonpolar lipids (triglycerides, diglycerides); CE = cholesteryl ester; NM = normalizer for amount eaten. (Figure 8—source data 1). PHENOTYPE:
|