
|
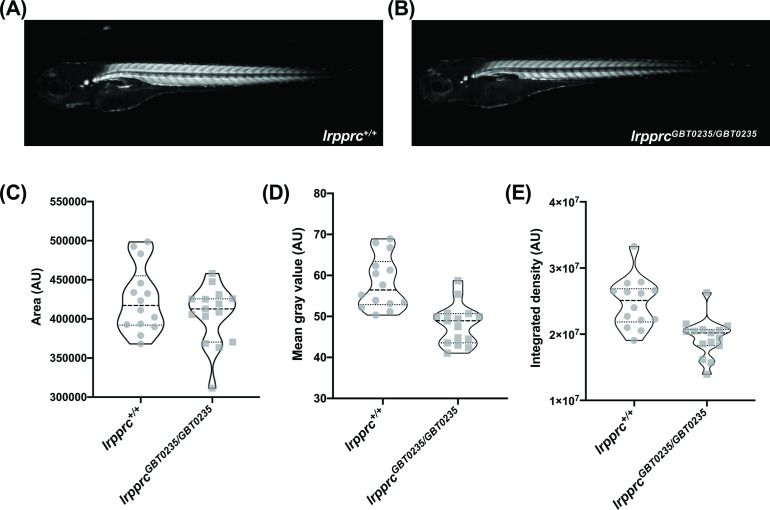
Figure 5 lrpprcGBT0235/GBT0235 mutants display decreased birefringence.
(A–B) Representative Birefringence images of lrpprc+/+ (A) and lrpprcGBT0235/GBT0235 mutants (B). (C–E) The images and graphs in the figure show the birefringence area of the region of interest (ROI) (C), mean gray value (D), and integrated density (E) between lrpprc+/+ and lrpprcGBT0235/GBT0235 mutants. lrpprcGBT0235/GBT0235 mutants display similar birefringence area (p-value = 0.4773) but a decrease in mean gray value (p-value < 0.0001) and integrated density (p-value = 0.0001). Each individual data point represents a single embryo (For lrpprc+/+; N=14 and lrpprcGBT0235/GBT0235; N=15). Each parental pair represents a biological replicate. p-Values were determined using the Mann-Whitney test. (Figure 5—source data 1) (magnification- 5×).