
Figure 4
|
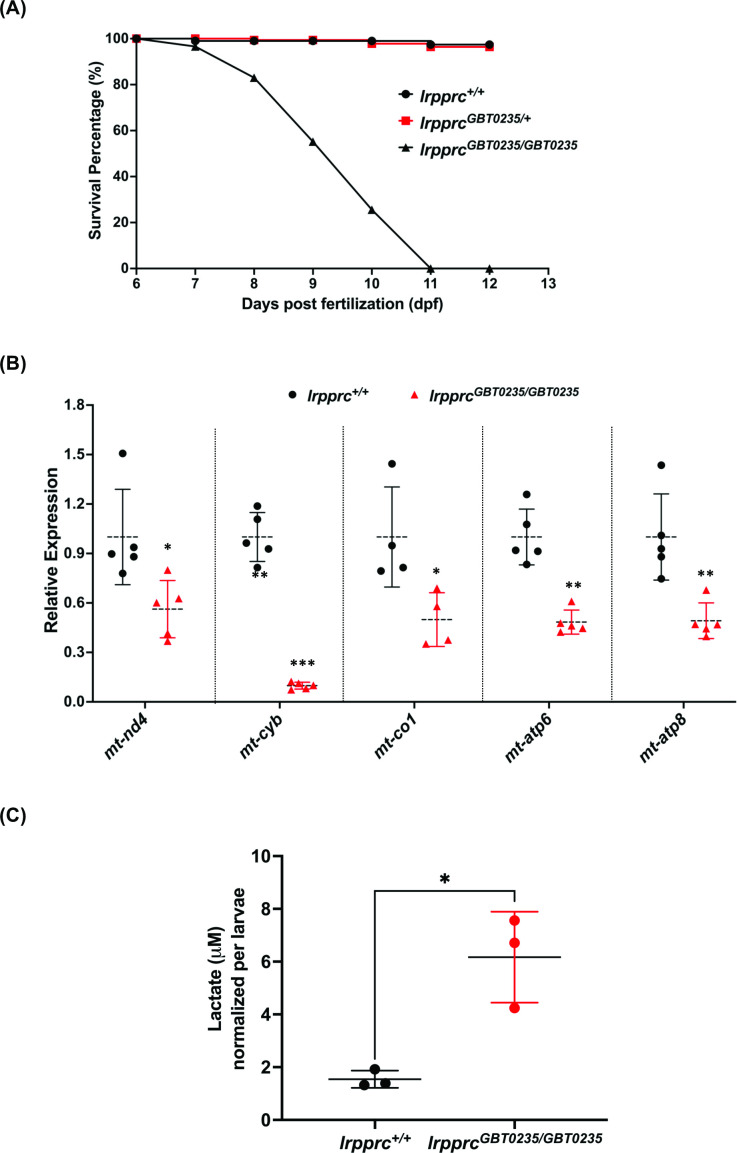
Figure 4 rpprcGBT0235/GBT0235 mutants recapitulate the hallmarks of LSFC.
(A) Survival percentage of lrpprc+/+, lrpprcGBT0235/+, and lrpprcGBT0235/GBT0235. Data is represented from independent experiments (N=5 pairs) (Figure 4—source data 1) (B) Relative expression of mtDNA transcripts in the lrpprcGBT0235/GBT0235 and lrpprc+/+ assessed by qRT-PCR. Mitochondrial transcripts were normalized to eef1a1l1 transcript levels. The black circle represents wild-type and the red triangle represents homozygous mutants. Each data point represents embryos from the different clutch. Error bars are represented as SD (*: p-value < 0.05, **: p-value < 0.01, ***: p-value < 0.001). p-Values were determined by unpaired t-test. p-values (mt-nd4=0.0248; mt-cyb=0.0001; mt-co1=0.0371; mt-atp6=0.0011; mt-atp8=0.0089). (Figure 4—source data 1) (C) Relative lactate levels in the whole-body lysates of wild-type and lrpprc homozygous siblings. Lactate levels were normalized to the number of larvae. Error bars are represented as SD (*: p-value = 0.0392). p-Value was determined using the unpaired t-test. (Figure 4—source data 1).