
|
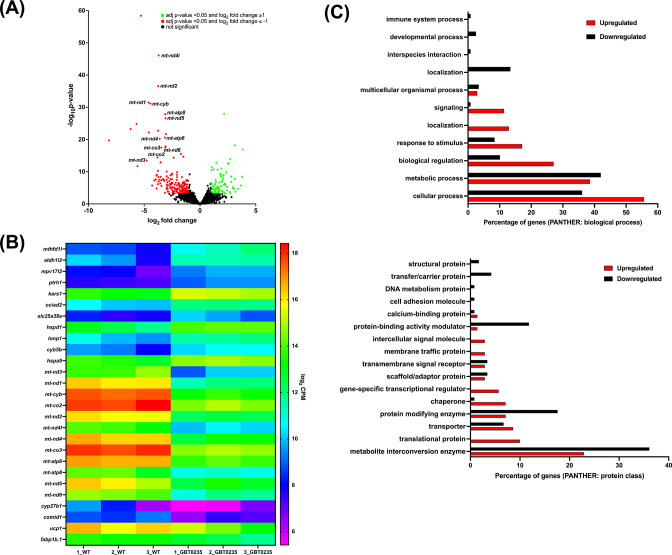
Figure 6 RNAseq of lrpprcGBT0235/GBT0235 homozygous mutants.
(A) Volcano plot of differentially expressed genes in the homozygous mutants. log2 of fold change and minus of log10 of p-value is represented on the x-axis and y-axis, respectively. The red dots signify the significantly downregulated genes and the green dots represent the significantly upregulated genes between the 6 dpf lrpprcGBT0235/GBT0235 and lrpprc+/+ larvae. Non-significant genes are represented by black dots (B) Heat map visualization of expression of zebrafish orthologs for human Mitocarta genes. The gradient color scale represents the log2CPM value obtained for each of the zebrafish mitochondrial orthologs across the biological replicates for each genotype. (C) PANTHER classification for all the significantly differentially expressed genes in the homozygous mutant according to protein class and biological process. Each histogram represents the percentage of genes having hits in the PANTHER database that fall in each of the categories, that is, biological process, and protein class.