
Figure 8
- ID
- ZDB-FIG-230123-28
- Publication
- Sabharwal et al., 2022 - Genetic therapy in a mitochondrial disease model suggests a critical role for liver dysfunction in mortality
- Other Figures
-
- Figure 1
- Figure 2
- Figure 2 - figure supplement 1
- Figure 2 - figure supplement 2
- Figure 2 - figure supplement 3
- Figure 3
- Figure 3 - figure supplement 1
- Figure 4
- Figure 4 - figure supplement 1
- Figure 5
- Figure 5 - figure supplement 1
- Figure 5 - figure supplement 2
- Figure 6
- Figure 7
- Figure 7 - figure supplement 1
- Figure 8
- All Figure Page
- Back to All Figure Page
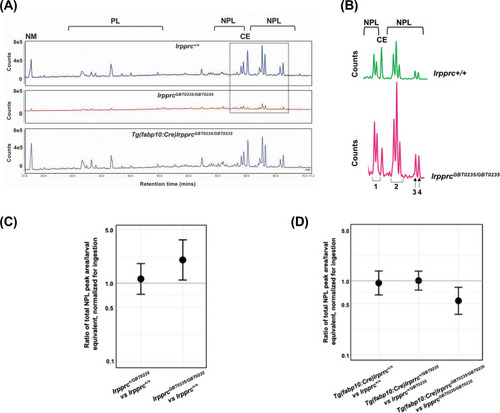
Genetic liver-specific rescue of altered dietary lipid metabolism in lrpprc homozygous mutant larvae. (A) Representative chromatographs are shown: lipid extractions from whole wild-type larvae (top) and whole lrpprc homozygous mutant larvae (middle). Peaks represent different lipid species and are quantified by peak area. Liver-specific rescue of lrpprcGBT0235/GBT0235 mutants restores nonpolar lipid levels to wild-type levels in liver-specific rescued homozygous mutant larvae (bottom). All peaks were normalized to the amount of non-metabolizable fluorescent reagent ingested (NM). (B) Excerpts from representative chromatographs, wild-type larvae (top), and lrpprc homozygous mutant larvae (bottom). Peaks or peak areas (labeled as 1–4) were individually analyzed for contribution to the overall higher NPL level in lrpprc homozygous mutants compared to their wild-type siblings. (C) 95% CI plot: lrpprcGBT0235/GBT0235 generated 2.04 times more non-polar lipids compared to their wild-type siblings (lrpprcGBT0235/GBT0235/lrpprc+/+=2.040, p-value = 0.019). p-Value was obtained from the standard normal z-table. (D) 95% CI plot: Tg(fabp10:Cre)lrpprcGBT0235/GBT0235 restored the levels of non polar lipids as compared to lrpprcGBT0235/GBT0235 homozygous mutants. PL = phospholipids; NPL = nonpolar lipids (triglycerides, diglycerides); CE = cholesteryl ester; NM = normalizer for amount eaten. (Figure 8—source data 1). |
| Fish: | |
|---|---|
| Observed In: | |
| Stage: | Day 6 |