
Figure 5 - figure supplement 1
- ID
- ZDB-IMAGE-230123-24
- Source
- Figures for Sabharwal et al., 2022
|
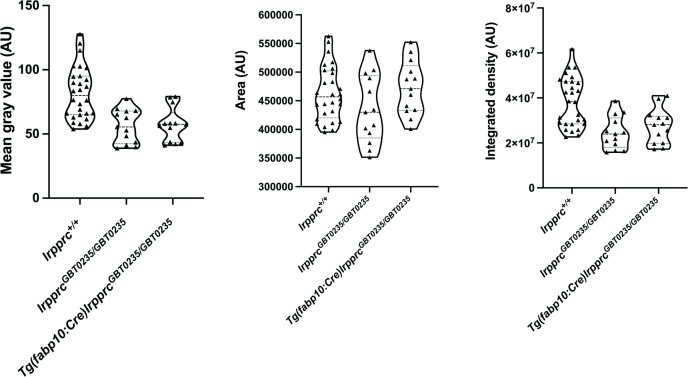
Figure 5 - figure supplement 1 lrpprcGBT0235/GBT0235 and Tg(fabp10:Cre)lrpprcGBT0235/GBT0235 mutants display decreased birefringence at 4 dpf.
Graphs displaying the birefringence area of the region of interest (ROI), mean gray value, and integrated density between lrpprc+/+, lrpprcGBT0235/GBT0235, and Tg(fabp10:Cre)lrpprcGBT0235/GBT0235 mutants at 4 dpf. lrpprcGBT0235/GBT0235 mutants display a decrease in mean gray value (p-value = 0.0003) and integrated density (p-value = 0.0002) as compared to wild type, whereas no significant difference in the birefringence area is observed (p-value = 0.1280). Tg(fabp10:Cre)lrpprcGBT0235/GBT0235 mutants do not display significant difference in the birefringence area (p-value = 0.1254), mean gray value (p-value = 0.7623) and integrated density (p-value = 0.3622) as compared to lrpprcGBT0235/GBT0235 mutants. Each individual data point represents a single animal (For lrpprc+/+; N=28, lrpprcGBT0235/GBT0235; N=13 and Tg(fabp10:Cre)lrpprcGBT0235/GBT0235; N=13). p-Values were determined using the Mann-Whitney test. (Figure 5—source data 1).