
- Title
-
The effects of an obesogenic diet on behavior and cognition in zebrafish (Danio rerio): Trait average, variability, repeatability, and behavioral syndromes
- Authors
- Anwer, H., O'Dea, R.E., Mason, D., Zajitschek, S., Klinke, A., Reid, M., Hesselson, D., Noble, D.W.A., Morris, M.J., Lagisz, M., Nakagawa, S.
- Source
- Full text @ Ecol Evol
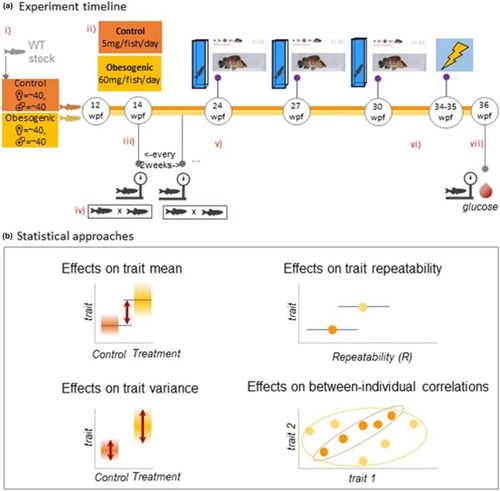
Experimental overview and statistical approach: (a): (i) WT stock assigned to obesogenic and control groups at 12 weeks post-fertilization (wpf); (ii) designated feeding amounts of Artemia; (iii) body weight measurements began at 14 wpf (continued every 2 weeks until the end of the experiment at 36 wpf); (iv) maintenance breeding within tanks occurred every 2–3 weeks for general health purposes and to prevent females from becoming eggbound (v) behavioral assays began at 24 wpf (3-week intervals); (vi) aversive learning assay began; (vii) final body weight measurement and fish were sacrificed for FBG (fasting blood glucose) measurements; (b) Statistical approaches: mean and variance differences calculated between control and obesogenic diet zebrafish groups through the use of mixed models; repeatability of behavior estimates calculated as the proportion of between-group (between-individual) variance out of total variance; and estimating whether different personality traits correlate at the between-individual level of variation (known as “behavioral syndromes”). |
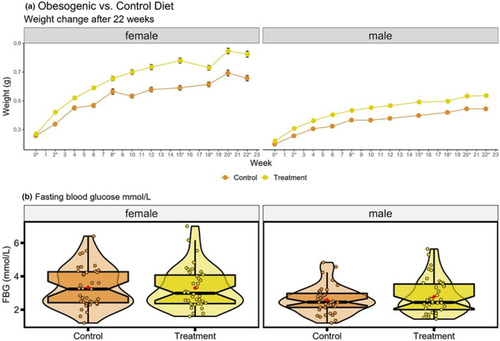
Body weight and fasting blood glucose (a) Body weight changes over a period of 22 weeks from first exposure for both males (n = 39–42) and females (n = 37–42) in control and obesogenic treatment groups (weeks marked with an asterisk are those where zebrafish were group-bred for health maintenance purposes). Data shown are mean ± SEM; and (b) Distributions of fasting blood glucose (mmol/L) at the end of the experiment, for control and obesogenic treatment group zebrafish, by sex. Circles represent mean value of three measures taken for each individual (males: n = 39 control, n = 41 obesogenic group, females: n = 39 control, n = 38 obesogenic group). Box plots show the median, 95% confidence interval, quantiles, and outliers. Violin plots display the distribution density. Average of mean values are denoted by red diamonds. |
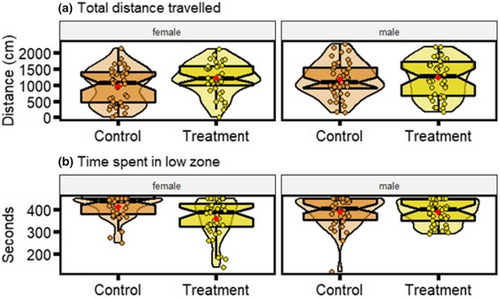
Distributions of behavioral parameters for anxiety assay (a) total distance traveled (cm) and (b) time spent in the low zone (seconds). Data displayed is for control and treatment zebrafish, of each sex. Each plot displays mean individual data points for males (n = 43 control, n = 41 treatment) and females (n = 40 control, n = 40 treatment) from three observations. Box plots show the median, its 95% confidence interval, quantiles, and outliers. Violin plots display the distribution density. Average of mean values are denoted by red diamonds. |
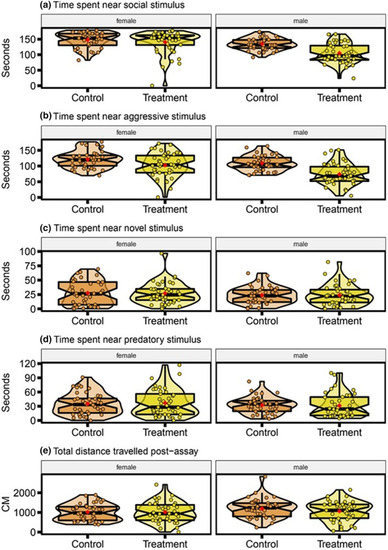
Distributions of behavioral parameters for personality assay (a) time spent near the social stimulus (seconds), (b) time spent near the aggressive stimulus (seconds), (c) time spent near the novel stimulus (seconds), (d) time spent near the predatory stimulus (seconds), (e) total distance traveled during the postassay period (cm). Data displayed as control and obesogenic treatment groups, separated by sex. Each plot displays mean individual data points for males (n = 41 control, n = 42 obesogenic) and females (n = 41 control, n = 41 obesogenic) from three observations. Box plots show median, 95% confidence interval, quantiles, and outliers. Violin plots display the distribution density. Average of mean values are denoted by red diamonds. |
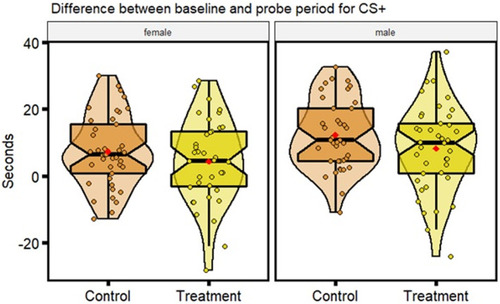
Distributions of behavioral parameters for aversive learning assay: Differences in time spent in the CS+ (color associated with the negative stimulus, a mild electric shock) before and after the aversive experience (seconds), with higher values indicating less time spent in the CS+; data displayed is for control and obesogenic treatment zebrafish, subsetted by sex. Each plot displays mean individual data points for males (n = 39 control, n = 41 obesogenic) and females (n = 41 control, n = 38 obesogenic) from two observations. Box plots show the median, 95% confidence interval of the median, quantiles, and outliers. Violin plots display the distribution density. Average of mean values are denoted by red diamonds |
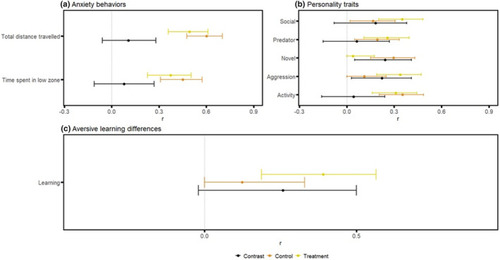
Forest plots of all repeatability estimates: Plot displays repeatability estimates for: (a) anxiety parameters total distance traveled, and time spent in the low zone; (b) personality traits of time spent near the stimulus during the social, predator, novel, and aggression phases, and total distance traveled for the activity phase; and (c) difference in time spent in the CS+ (color associated with the negative stimulus, a mild electric shock) before and after the aversive experience. Repeatability estimates are deemed statistically significant if the associated 95% confidence interval does not cross 0. The contrasts between the control and treatment group are deemed significant if the associated confidence interval does not cross 0. |
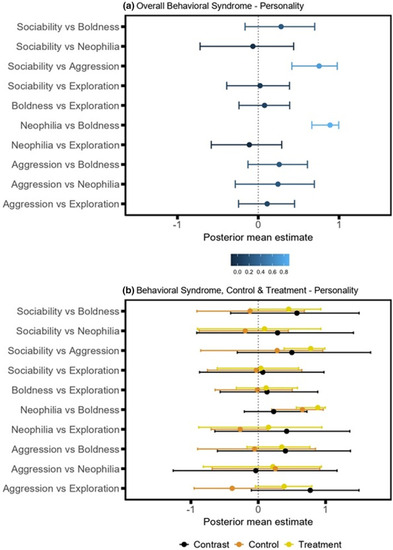
Forest plots of mean posterior estimates from bivariate models: Plot displayed mean and 95% credible intervals for (a) overall behavioral syndrome analysis (lighter blue shades indicate higher posterior mean estimates); and (b) behavioral syndrome analysis subsetted by group, with contrast analysis to determine differences between control and treatment zebrafish. Posterior mean estimates are deemed significant if the associated 95% confidence interval does not cross 0. The contrasts between the control and treatment group are deemed significant if the associated confidence interval does not cross 0. |