
FIGURE
FIGURE 3
- ID
- ZDB-FIG-221211-120
- Publication
- Anwer et al., 2022 - The effects of an obesogenic diet on behavior and cognition in zebrafish (Danio rerio): Trait average, variability, repeatability, and behavioral syndromes
- Other Figures
- All Figure Page
- Back to All Figure Page
FIGURE 3
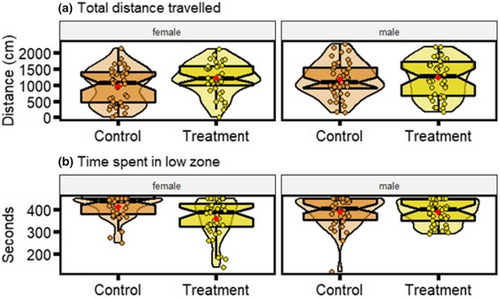
Distributions of behavioral parameters for anxiety assay (a) total distance traveled (cm) and (b) time spent in the low zone (seconds). Data displayed is for control and treatment zebrafish, of each sex. Each plot displays mean individual data points for males (n = 43 control, n = 41 treatment) and females (n = 40 control, n = 40 treatment) from three observations. Box plots show the median, its 95% confidence interval, quantiles, and outliers. Violin plots display the distribution density. Average of mean values are denoted by red diamonds. |
Expression Data
Expression Detail
Antibody Labeling
Phenotype Data
Phenotype Detail
Acknowledgments
This image is the copyrighted work of the attributed author or publisher, and
ZFIN has permission only to display this image to its users.
Additional permissions should be obtained from the applicable author or publisher of the image.
Full text @ Ecol Evol