
FIGURE 4
- ID
- ZDB-FIG-221211-121
- Publication
- Anwer et al., 2022 - The effects of an obesogenic diet on behavior and cognition in zebrafish (Danio rerio): Trait average, variability, repeatability, and behavioral syndromes
- Other Figures
- All Figure Page
- Back to All Figure Page
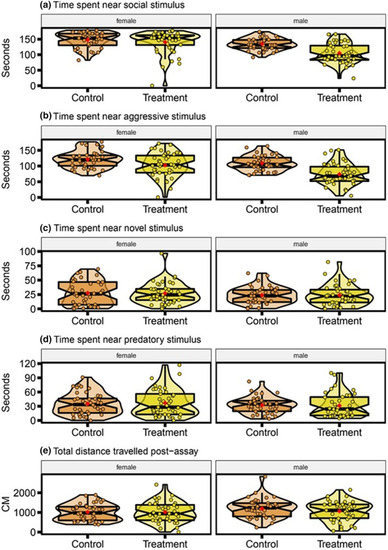
Distributions of behavioral parameters for personality assay (a) time spent near the social stimulus (seconds), (b) time spent near the aggressive stimulus (seconds), (c) time spent near the novel stimulus (seconds), (d) time spent near the predatory stimulus (seconds), (e) total distance traveled during the postassay period (cm). Data displayed as control and obesogenic treatment groups, separated by sex. Each plot displays mean individual data points for males (n = 41 control, n = 42 obesogenic) and females (n = 41 control, n = 41 obesogenic) from three observations. Box plots show median, 95% confidence interval, quantiles, and outliers. Violin plots display the distribution density. Average of mean values are denoted by red diamonds. |