
FIGURE 6
- ID
- ZDB-IMAGE-221211-125
- Publication
- Anwer et al., 2022 - The effects of an obesogenic diet on behavior and cognition in zebrafish (Danio rerio): Trait average, variability, repeatability, and behavioral syndromes
- All Figures
- Figures for Anwer et al., 2022
|
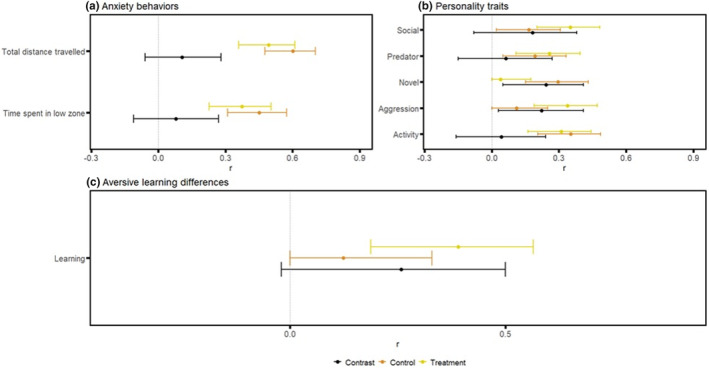
FIGURE 6 Forest plots of all repeatability estimates: Plot displays repeatability estimates for: (a) anxiety parameters total distance traveled, and time spent in the low zone; (b) personality traits of time spent near the stimulus during the social, predator, novel, and aggression phases, and total distance traveled for the activity phase; and (c) difference in time spent in the CS+ (color associated with the negative stimulus, a mild electric shock) before and after the aversive experience. Repeatability estimates are deemed statistically significant if the associated 95% confidence interval does not cross 0. The contrasts between the control and treatment group are deemed significant if the associated confidence interval does not cross 0.