
|
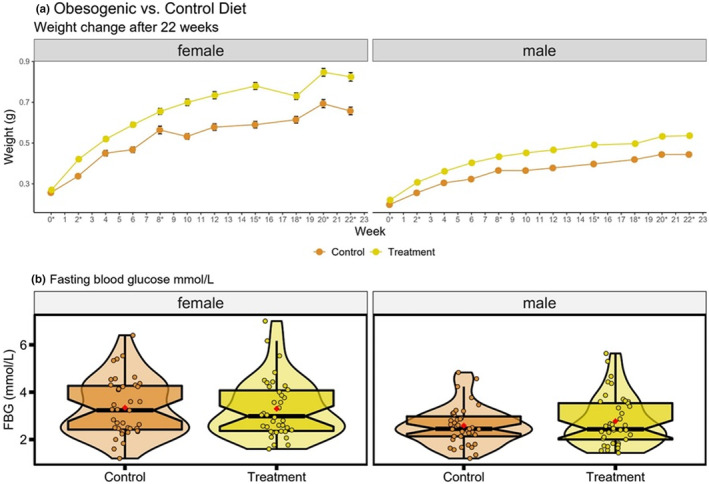
FIGURE 2 Body weight and fasting blood glucose (a) Body weight changes over a period of 22 weeks from first exposure for both males (n = 39–42) and females (n = 37–42) in control and obesogenic treatment groups (weeks marked with an asterisk are those where zebrafish were group-bred for health maintenance purposes). Data shown are mean ± SEM; and (b) Distributions of fasting blood glucose (mmol/L) at the end of the experiment, for control and obesogenic treatment group zebrafish, by sex. Circles represent mean value of three measures taken for each individual (males: n = 39 control, n = 41 obesogenic group, females: n = 39 control, n = 38 obesogenic group). Box plots show the median, 95% confidence interval, quantiles, and outliers. Violin plots display the distribution density. Average of mean values are denoted by red diamonds.