
|
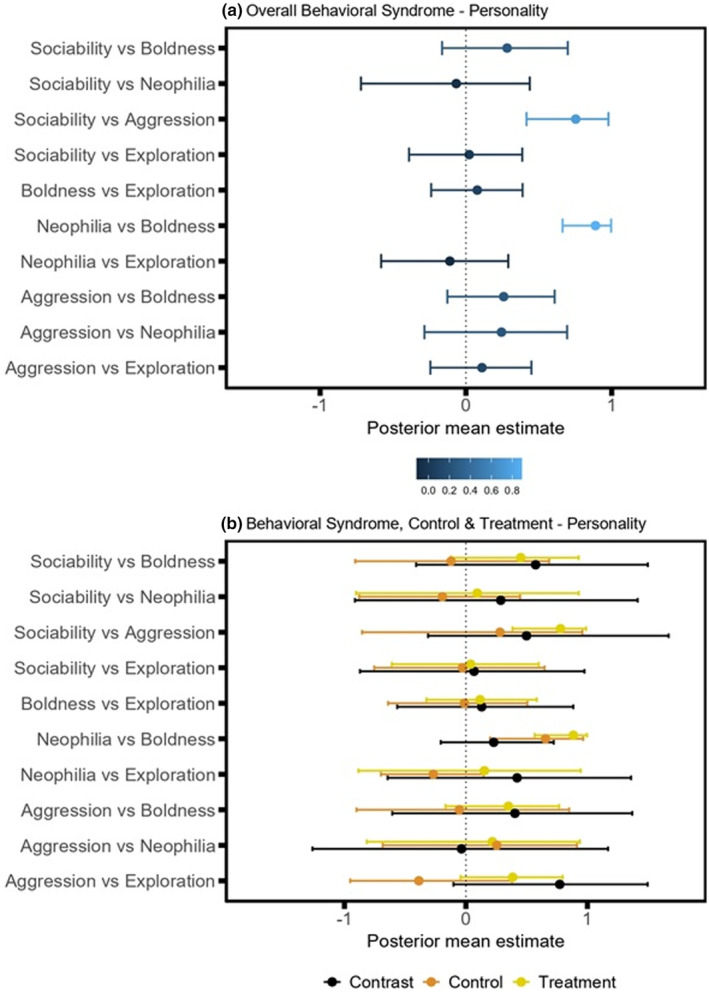
FIGURE 7 Forest plots of mean posterior estimates from bivariate models: Plot displayed mean and 95% credible intervals for (a) overall behavioral syndrome analysis (lighter blue shades indicate higher posterior mean estimates); and (b) behavioral syndrome analysis subsetted by group, with contrast analysis to determine differences between control and treatment zebrafish. Posterior mean estimates are deemed significant if the associated 95% confidence interval does not cross 0. The contrasts between the control and treatment group are deemed significant if the associated confidence interval does not cross 0.