
- Title
-
Control of cranial ectomesenchyme fate by Nr2f nuclear receptors
- Authors
- Okeke, C., Paulding, D., Riedel, A., Paudel, S., Phelan, C., Teng, C.S., Barske, L.
- Source
- Full text @ Development

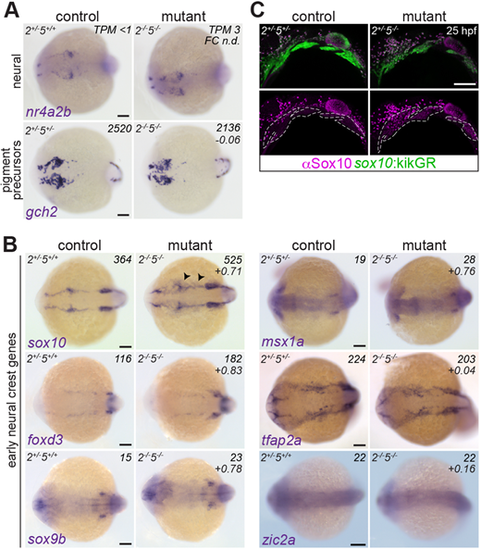
Suppression of the ectomesenchyme program in nr2f2el/el;nr2f5el/el mutants. (A) nr2f5 single and nr2f2;nr2f5 double mutants show reduced fli1a:EGFP in the arches at 26 hpf. sox10:DsRed marks NC-derived cells; dashed lines indicate arch boundaries. (B) Breeding strategy for FACS and RNAseq of sox10:DsRed+ cells from control and nr2f5 mutant embryos. (C) DESeq2-generated log2-transformed fold-change values of genes enriched in distinct NC lineages between mutants and controls. Bars indicate the mean. (D) In situ hybridizations for ectomesenchyme genes in controls and double mutants at 20 hpf (dorsal views, anterior towards the left). Arrowheads indicate diminished expression. The three bilateral CNCC streams are marked in the top left image. Bottom right numbers are log2-transformed fold-change values from the RNAseq experiment. *The fli1a fold-change value is considered unreliable due to the fli1a:EGFP transgene being present in the mutant but not in the control sample. Scale bars: 20 µm in A; 100 µm in D. EXPRESSION / LABELING:
PHENOTYPE:
|
Behavior of non-ectomesenchyme and early NC genes in nr2f2el/el;nr2f5el/el mutants. (A) In situ hybridizations analysis showing that markers of alternate lineages are not overtly upregulated at 20 hpf. (B) In situ hybridizations for early NC genes in control and double mutants at 20 hpf. Arrowheads indicate elevated sox10 expression. In A,B, top right numbers are the average TPM values in the RNAseq data, with the log2-transformed fold-change DESeq2 values underneath. (C) Immunostaining showing ectopic Sox10 protein in the arches (outlined) at 25 hpf. sox10:kikGR marks NC-derived cells. Scale bars: 100 µm. EXPRESSION / LABELING:
PHENOTYPE:
|
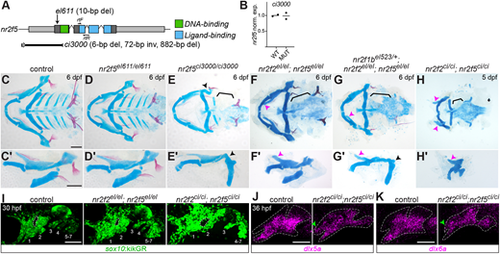
Worsened skeletal phenotypes in new nr2f5 mutant. (A) Schematic of nr2f5, with the deletions, RT-PCR primers (rtF and rtR) and functional domains marked. (B) RT-PCR quantification showing similar normalized nr2f5 transcript levels in wild types and nr2f5ci3000 mutants at 52 hpf. (C-H′) Skeletal preparations of nr2f5 single and combinatorial mutants, visualized as ventral (C-H) and lateral (C′-H′) mounts. Black arrowheads indicate the dysmorphic hyomandibula; brackets highlight missing ceratobranchials; pink arrowheads indicate the transformed upper jaw cartilage. (I) Disrupted arch morphology in double mutants at 30 hpf revealed with the sox10:kikGR transgene. Arches are numbered, and the white dotted line surrounds the first pharyngeal pouch. (J,K) Expression of the mandibular markers dlx5a and dlx6a is expanded into the maxillary prominence (green arrowhead) in nr2f2ci/ci;nr2f5ci/ci mutants. Scale bars: 100 µm in C-I; 50 µm in J,K. |
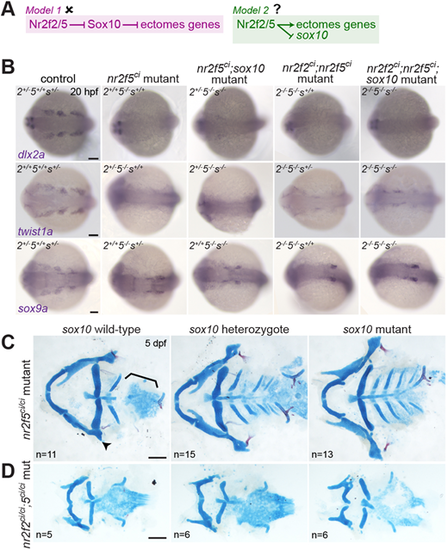
Loss of sox10 rescues the skeletal but not ectomesenchyme program in nr2f5ci/ci mutants. (A) Possible genetic relationships linking Nr2f2 and/or Nr2f5, sox10 and the ectomesenchyme program. (B) Ectomesenchyme genes were more dramatically reduced in nr2f5ci/ci and double nr2f2ci/ci;nr2f5ci/ci mutants (compare with Fig. 1D, Fig. S2). Expression is not rescued by reducing sox10 dose. (C,D) Loss of one or two copies of sox10 rescues the hyomandibular and ceratobranchial phenotypes of nr2f5ci/ci single mutants (C) but not the more severe defects of nr2f2ci/ci;nr2f5ci/ci mutants (D). In C, 10/11, 4/15 and 0/13 nr2f5ci/ci mutants that were, respectively, wild type, heterozygous or mutant for sox10 showed hyomandibular and ceratobranchial phenotypes. Scale bars: 100 µm. EXPRESSION / LABELING:
PHENOTYPE:
|