
- Title
-
Disruption of the glucagon receptor increases glucagon expression beyond α-cell hyperplasia in zebrafish
- Authors
- Kang, Q., Zheng, J., Jia, J., Xu, Y., Bai, X., Chen, X., Zhang, X.K., Wong, F.S., Zhang, C., Li, M.
- Source
- Full text @ J. Biol. Chem.
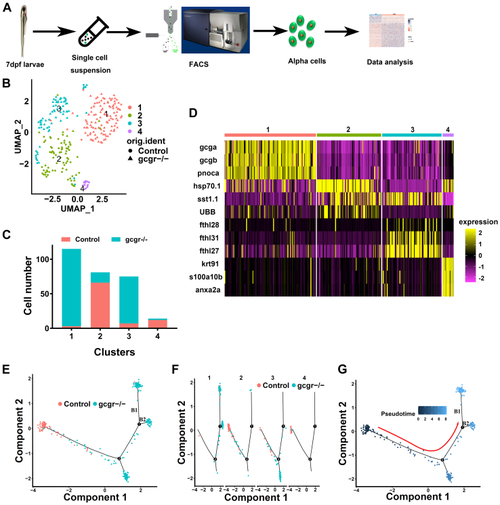
The single-cell transcriptomic overview of αcells from gcgr−/−and control zebrafish.A, schematic of single-cell isolation and single-cell RNA-seq from the zebrafish reporter line Tg (gcga:GFP). B, distribution of all α cells by uniform manifold approximation and projection for dimension reduction (UMAP) analysis. All cells were segregated into four clusters, each cluster was labeled using different colors, the circles and triangles indicate α-cells from control and gcgr−/−, respectively. C. the cell numbers of each cluster 1 to 4 are shown. D, the heatmap shows the top 3 markers in each cluster; the color scale ranges from magenta to yellow corresponding to the gene expression as indicated. E–G, the pseudotime trajectory analysis of control and gcgr−/− mutant α-cells. E, trajectory colored by samples of control or gcgr−/−. F, trajectory colored by individual clusters. G, trajectory colored by pseudotime, and the color in each cell depends on the pseudotime value ranging from 0 to 8. All plots for pseudotime trajectory are based on cell distribution as shown in Fig. 1E. All cells from control and gcgr−/− mutant were aligned in pseudotime trajectory by monocle v2.16.0, number 1 and 2 presented decision point 1 and point 2; B1 and B2 presented branch 1 and branch 2. |
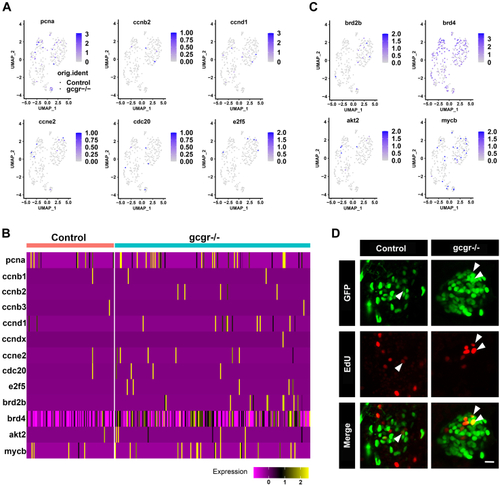
KO of GCGR in zebrafish induced proliferation in αcells.A, the plots show the expression of several cell cycle regulatory genes in all cells, the circles and triangles indicate α cells from control and gcgr−/− zebrafish, respectively, the color scale ranges gray to blue corresponding to expression level from low to high, all plots are based on cell clusters shown in Fig. 1B. B, heatmap of 13 cell cycle regulatory and associated genes in α cells from control and gcgr−/− group. C, the plots show the expression of several cell cycle associated genes in all cells. The columns represent cells and the rows represent genes as indicated. The color scale ranges purple to yellow corresponding to expression level from low to high, all plots are based on cell clusters shown inFig. 1B. D, representative images of EdU-labeled zebrafish islets from control Tg(gcga:GFP) and gcgr−/−;Tg(gcgr−/−;gcga:GFP) groups; the EdU+ and GFP+ cells represent the proliferative α-cells, which are indicated by the arrows; the scale bar represents 10um. GCGR, glucagon receptor. |
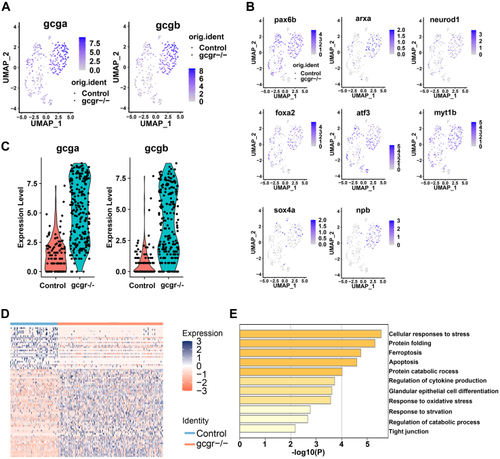
KO of GCGR in zebrafish increased glucagon expression in α-cells.A and B, the plots show the expression of glucagon genes (A) and their regulators (B). The color scale ranges gray to blue corresponding to expression level from low to high; all plots are based on cell clusters shown in Fig. 1B. C, the violin plots show gcga and gcgb relative expression in α-cells from control and gcgr−/− zebrafish. D, heatmap of differentially expressed genes (DEGs) of gcgr−/− compared to control cells; the color scale ranges red to blue corresponding to expression level from low to high. E, pathway enrichment analysis of DEGs between gcgr−/− and control cells. GCGR, glucagon receptor. |
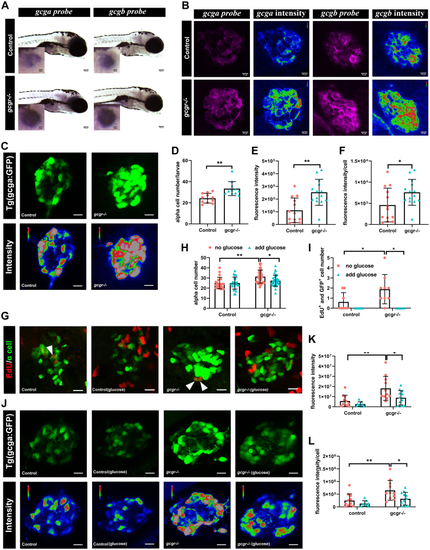
Validation of single cell RNA data showing upregulated glucagon expression in gcgr−/−zebrafish αcells.A, whole mount in situ hybridization analysis of gcga and gcgb in the control and gcgr−/− α cells. The scale bar represents 100um, Scale bar in inset = 10um. B, fluorescence in situ hybridization analysis of gcga and gcgb in control and gcgr−/− α cells. The scale bars represent 10 μm. C, representative images of the fluorescence (green) and intensity (rainbow) of α-cells from Tg(gcga:GFP) and gcgr−/−;Tg(gcga:GFP) zebrafish. The scale bars represent 10 μm. D, quantification of the α-cell number from Tg(gcga:GFP) and gcgr−/−;Tg(gcga:GFP) zebrafish. E, quantification of fluorescence intensity from Tg(gcga:GFP) and gcgr−/−;Tg(gcga:GFP) zebrafish. F, the average fluorescence intensity in each α-cell from Tg(gcga:GFP) and gcgr−/−;Tg(gcga:GFP) zebrafish. D–F, data represent mean ± SD with significance determined by unpaired two-tailed t test, ∗ p< 0.05; ∗∗ p< 0.01. G–L, hyperexpression and hyperplasia of glucagon in gcgr−/− α-cells was inhibited by a high level of glucose. G–I, representative EdU staining images (G), α-cell quantification (H), and EdU-positive α-cell quantification (I) of different genotype larvae treated by high-level glucose. GFP+ and EdU+ cells represent the proliferative α-cells, which are indicated by arrows. Data represent mean ± SD with significance determined by two-way ANOVA, ∗ p< 0.05. The number of larvae (n) =20 to 36 for 4H, 5 to 8 for 4I. ANOVA results for 4H: interaction: F (1, 112) = 3.047, p = 0.0836; Row factor (control versus gcgr−/−): F (1, 112) = 15.16, p = 0.0002; Column factor (glucose treatment): F (1, 112) = 3.141, p = 0.0791. ANOVA results for 4I: interaction: F (1, 26) = 3.252, p = 0.083; Row factor (control versus gcgr−/−): F (1, 26) = 3.252, p = 0.083; Column factor (glucose treatment): F (1, 26) = 12.86, p = 0.0014. J, representative images of the fluorescence (green) and intensity (rainbow) of α-cells from Tg(gcga:GFP), gcgr−/−;Tg(gcga:GFP) zebrafish, and high glucose-treated Tg(gcga:GFP) and gcgr−/−;Tg(gcga:GFP) zebrafish. The images are confocal projections; the scale bars represent 10 μm. K–L, quantification of total fluorescence intensity of GFP (K), and average fluorescence intensity of GFP per cell (L) from Tg(gcga:GFP), gcgr−/−;Tg(gcga:GFP) zebrafish, and high glucose-treated Tg(gcga:GFP) and gcgr−/−;Tg(gcga:GFP) zebrafish. Data represent mean ± SD with significance determined by two-way ANOVA, ∗ p< 0.05; ∗∗ p< 0.01, ∗∗∗p < 0.001. The number of larvae (n) =9 to 11 ANOVA results for 4K: interaction: F (1, 39) = 1.789, p = 0.1887; Row factor (control versus gcgr−/−): F (1, 39) = 15.60, p = 0.0003; Column factor (glucose treatment): F (1, 39) = 6.641, p = 0.0139. ANOVA results for 4L: interaction: F (1, 39) = 1.553, p = 0.2201; Row factor (control versus gcgr−/−): F (1, 39) = 12.00, p = 0.0013; Column factor (glucose treatment): F (1, 39) = 7.076, p = 0.0113. |
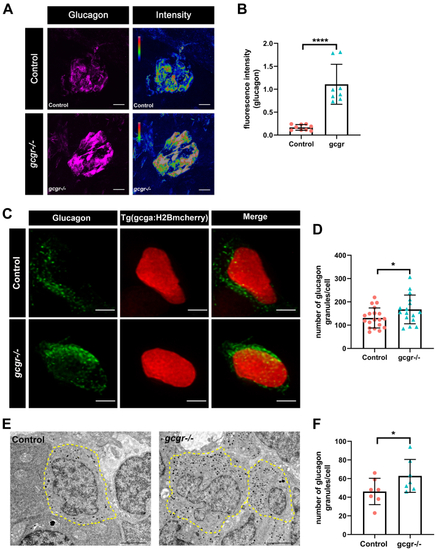
gcgr−/−zebrafish increase glucagon granules and glucagon level.A, representative images of the fluorescence (magenta) and intensity (rainbow) of α-cells from control and gcgr−/− zebrafish, which are indicated by immunostaining with antiglucagon antibody; the scale bar represents 10um. B, quantification of fluorescence intensity of the images from control and gcgr−/− zebrafish. Data represent mean ± SD with significance determined by unpaired two-tailed t test, ∗∗∗∗p < 0.0001. The number of larvae (n) = 8 to 9. C, representative images of α-cells in Tg(gcga:H2BmCherry) and gcgr−/−;Tg(gcga:H2BmCherry) larvae, immunostained with antiglucagon antibody. Green staining indicates intracellular glucagon granules; mCherry protein shown as red labels the nucleus of α cells. The scale bar represent 2 μm. D, quantification of the glucagon granules content per cell from immunostained Tg(gcga:H2BmCherry) and gcgr−/−;Tg(gcga:H2BmCherry) zebrafish. Data represent mean ± SD with significance determined by unpaired two-tailed t test, ∗ p< 0.05, n =16 to 19 cells. E, electron micrographs of control and gcgr−/− zebrafish. The cell boundary is depicted by dotted lines, and the glucagon granules are as gray and black dots in the cells. F, quantification of the glucagon granules content of control and gcgr−/− from transmission electron microscopy (TEM). The scale bar represents 2 μm. Data represent mean ± SD with significance determined by unpaired two-tailed t test, ∗ p< 0.05, n = 15 to 18 cells. |
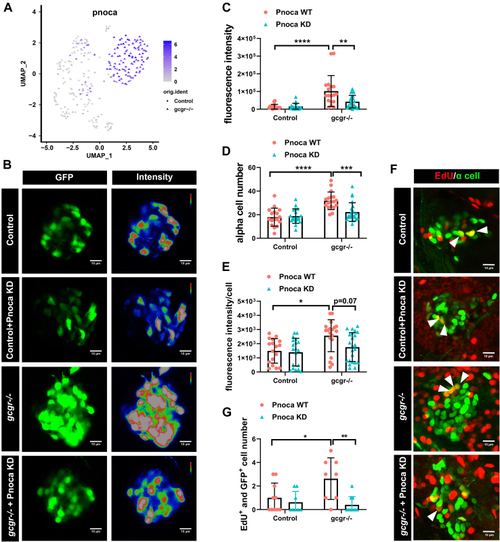
Knockdown of pnoca reduces α-cell number and glucagon expression in the gcgr−/−zebrafish group.A, the plots show the expression of pnoca gene, all plots are based on cell clusters shown in Fig. 1B. B, representative images of the fluorescence intensity of α cells from Tg(gcga:GFP)(control), pnoca knockdown (pnoca KD) Tg(gcga:GFP), gcgr−/−;Tg(gcga:GFP), and pnoca knockdown gcgr−/−;Tg(gcga:GFP) zebrafish in their respective groups. C–E, quantification of the islet fluorescence intensity (C) α-cell number (D) and fluorescence intensity in per cell (E) from control, gcgr−/−, and pnoca knockdown in the respective group. Data represent mean ± SD with significance determined by two-way ANOVA, ∗ p< 0.05; ∗∗ p< 0.01, ∗∗∗ p< 0.001, ∗∗∗∗ p < 0.0001, n =17 to 23. ANOVA results for 6C: interaction: F (1, 73) = 7.829, p = 0.0066; Row factor (control versus gcgr−/−): F (1, 73) = 27.97, p = 0.0001; Column factor (pnoca knockdown): F (1, 73) = 6.847, p = 0.0108. ANOVA results for 6D: interaction: F (1, 73) = 9.566, p = 0.0028; Row factor (control versus gcgr−/−): F (1, 73) = 26.31, p = 0.0001; Column factor (pnoca knockdown): F (1, 73) = 6.523, p = 0.0127. ANOVA results for 6E: interaction: F (1, 74) = 2.425, p = 0.1237; Row factor (control versus gcgr−/−): F (1, 74) = 9.723, p = 0.0026; Column factor (pnoca knockdown): F (1, 74) = 3.856, p = 0.0533. F–G, the representative EdU staining images (F) and quantification (G) of Tg(gcga:GFP)(control), pnoca knockdown (pnoca KD) Tg(gcga:GFP), gcgr−/−;Tg(gcga:GFP), and pnoca knockdown gcgr−/−;Tg(gcga:GFP) zebrafish. GFP+ and EdU+ cells represent the proliferative α cells, which are indicated by arrows. G, data represent mean ± SD with significance determined by two-way ANOVA ∗ p < 0.05; ∗∗ p < 0.01, n=8 to 10. ANOVA results for 6G: interaction: F (1, 32) = 5.274, p = 0.0283; Row factor (control versus gcgr−/−): F (1, 32) = 3.020, p = 0.0919; Column factor (pnoca knockdown): F (1, 32) = 10.42, p = 0.0029. |
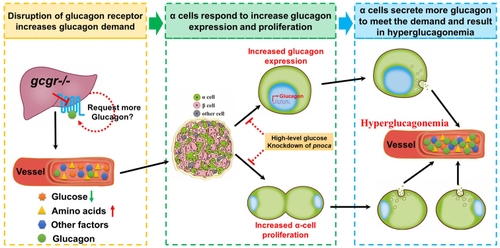
A working model for GCGR disruption resulting in hyperglucagonemia. Disruption of GCGR increases glucagon demand due to feedback signals from the liver and other tissues. The metabolic remodeling following GCGR disruption in the liver induces circulating factor/factors and these are transmitted to the islet. The α cells in the islet respond to these factors in two ways, one of which is to upregulate glucagon expression and the other is to induce α-cell hyperplasia. Both induce more glucagon secretion to meet the increased glucagon demand, which results in hyperglucagonemia in the circulation. However, administering high-level glucose or knockdown of pnoca in the GCGR KO animals suppresses both glucagon expression and α-cell hyperplasia. The dashed lines and circles indicate that there is uncertainty as to whether these effects are direct or indirect. GCGR, glucagon receptor. |