
|
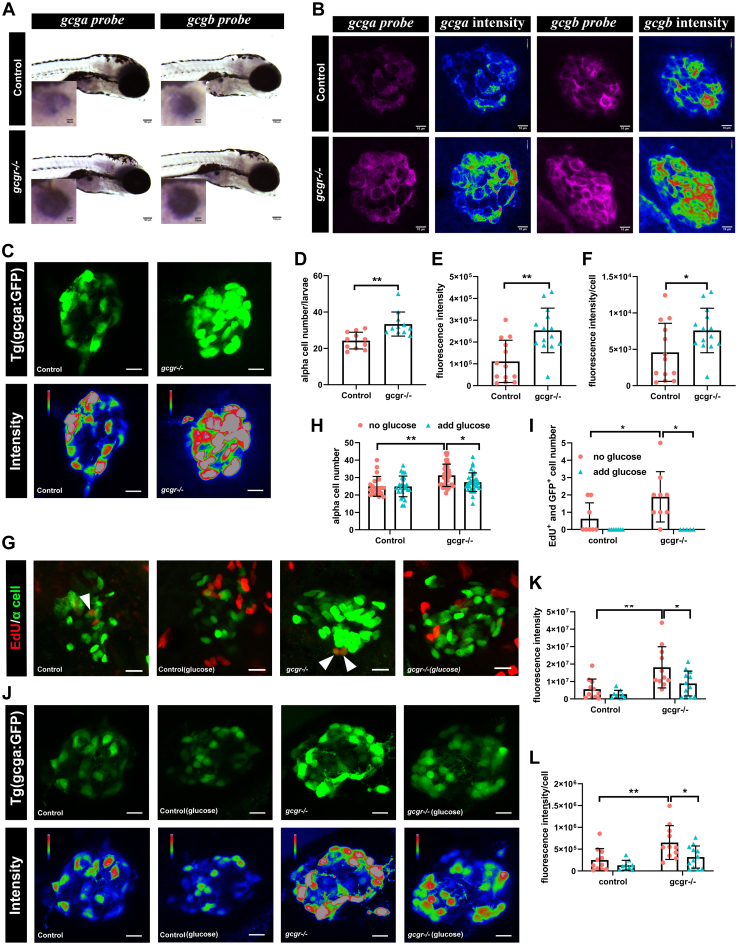
Figure 4
Validation of single cell RNA data showing upregulated glucagon expression in gcgr−/−zebrafish αcells.A, whole mount in situ hybridization analysis of gcga and gcgb in the control and gcgr−/− α cells. The scale bar represents 100um, Scale bar in inset = 10um. B, fluorescence in situ hybridization analysis of gcga and gcgb in control and gcgr−/− α cells. The scale bars represent 10 μm. C, representative images of the fluorescence (green) and intensity (rainbow) of α-cells from Tg(gcga:GFP) and gcgr−/−;Tg(gcga:GFP) zebrafish. The scale bars represent 10 μm. D, quantification of the α-cell number from Tg(gcga:GFP) and gcgr−/−;Tg(gcga:GFP) zebrafish. E, quantification of fluorescence intensity from Tg(gcga:GFP) and gcgr−/−;Tg(gcga:GFP) zebrafish. F, the average fluorescence intensity in each α-cell from Tg(gcga:GFP) and gcgr−/−;Tg(gcga:GFP) zebrafish. D–F, data represent mean ± SD with significance determined by unpaired two-tailed t test, ∗ p< 0.05; ∗∗ p< 0.01. G–L, hyperexpression and hyperplasia of glucagon in gcgr−/− α-cells was inhibited by a high level of glucose. G–I, representative EdU staining images (G), α-cell quantification (H), and EdU-positive α-cell quantification (I) of different genotype larvae treated by high-level glucose. GFP+ and EdU+ cells represent the proliferative α-cells, which are indicated by arrows. Data represent mean ± SD with significance determined by two-way ANOVA, ∗ p< 0.05. The number of larvae (n) =20 to 36 for 4H, 5 to 8 for 4I. ANOVA results for 4H: interaction: F (1, 112) = 3.047, p = 0.0836; Row factor (control versus gcgr−/−): F (1, 112) = 15.16, p = 0.0002; Column factor (glucose treatment): F (1, 112) = 3.141, p = 0.0791. ANOVA results for 4I: interaction: F (1, 26) = 3.252, p = 0.083; Row factor (control versus gcgr−/−): F (1, 26) = 3.252, p = 0.083; Column factor (glucose treatment): F (1, 26) = 12.86, p = 0.0014. J, representative images of the fluorescence (green) and intensity (rainbow) of α-cells from Tg(gcga:GFP), gcgr−/−;Tg(gcga:GFP) zebrafish, and high glucose-treated Tg(gcga:GFP) and gcgr−/−;Tg(gcga:GFP) zebrafish. The images are confocal projections; the scale bars represent 10 μm. K–L, quantification of total fluorescence intensity of GFP (K), and average fluorescence intensity of GFP per cell (L) from Tg(gcga:GFP), gcgr−/−;Tg(gcga:GFP) zebrafish, and high glucose-treated Tg(gcga:GFP) and gcgr−/−;Tg(gcga:GFP) zebrafish. Data represent mean ± SD with significance determined by two-way ANOVA, ∗ p< 0.05; ∗∗ p< 0.01, ∗∗∗p < 0.001. The number of larvae (n) =9 to 11 ANOVA results for 4K: interaction: F (1, 39) = 1.789, p = 0.1887; Row factor (control versus gcgr−/−): F (1, 39) = 15.60, p = 0.0003; Column factor (glucose treatment): F (1, 39) = 6.641, p = 0.0139. ANOVA results for 4L: interaction: F (1, 39) = 1.553, p = 0.2201; Row factor (control versus gcgr−/−): F (1, 39) = 12.00, p = 0.0013; Column factor (glucose treatment): F (1, 39) = 7.076, p = 0.0113.