
Figure 2
- ID
- ZDB-IMAGE-221214-226
- Publication
- Kang et al., 2022 - Disruption of the glucagon receptor increases glucagon expression beyond α-cell hyperplasia in zebrafish
- All Figures
- Figures for Kang et al., 2022
|
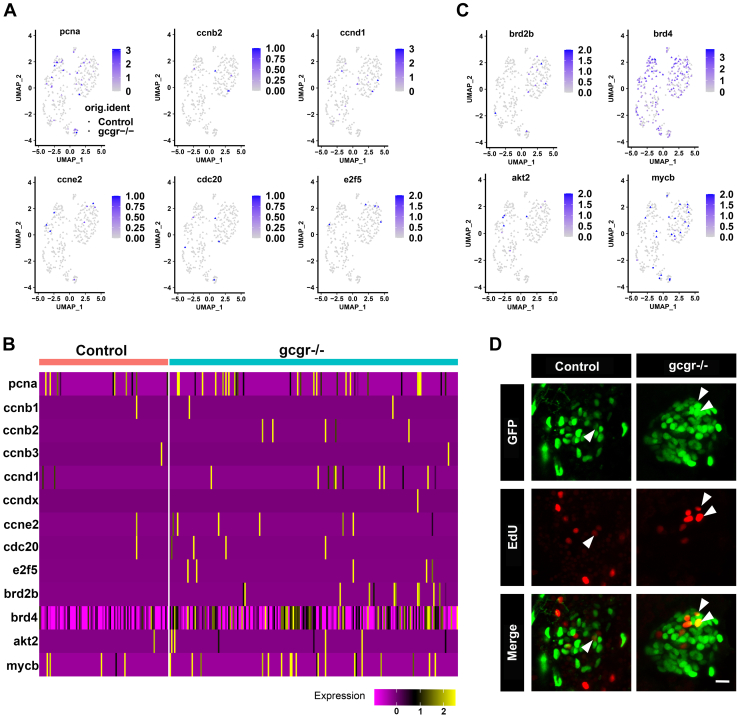
Figure 2
KO of GCGR in zebrafish induced proliferation in αcells.A, the plots show the expression of several cell cycle regulatory genes in all cells, the circles and triangles indicate α cells from control and gcgr−/− zebrafish, respectively, the color scale ranges gray to blue corresponding to expression level from low to high, all plots are based on cell clusters shown in Fig. 1B. B, heatmap of 13 cell cycle regulatory and associated genes in α cells from control and gcgr−/− group. C, the plots show the expression of several cell cycle associated genes in all cells. The columns represent cells and the rows represent genes as indicated. The color scale ranges purple to yellow corresponding to expression level from low to high, all plots are based on cell clusters shown inFig. 1B. D, representative images of EdU-labeled zebrafish islets from control Tg(gcga:GFP) and gcgr−/−;Tg(gcgr−/−;gcga:GFP) groups; the EdU+ and GFP+ cells represent the proliferative α-cells, which are indicated by the arrows; the scale bar represents 10um. GCGR, glucagon receptor.