
Figure 1
- ID
- ZDB-IMAGE-221214-224
- Publication
- Kang et al., 2022 - Disruption of the glucagon receptor increases glucagon expression beyond α-cell hyperplasia in zebrafish
- All Figures
- Figures for Kang et al., 2022
|
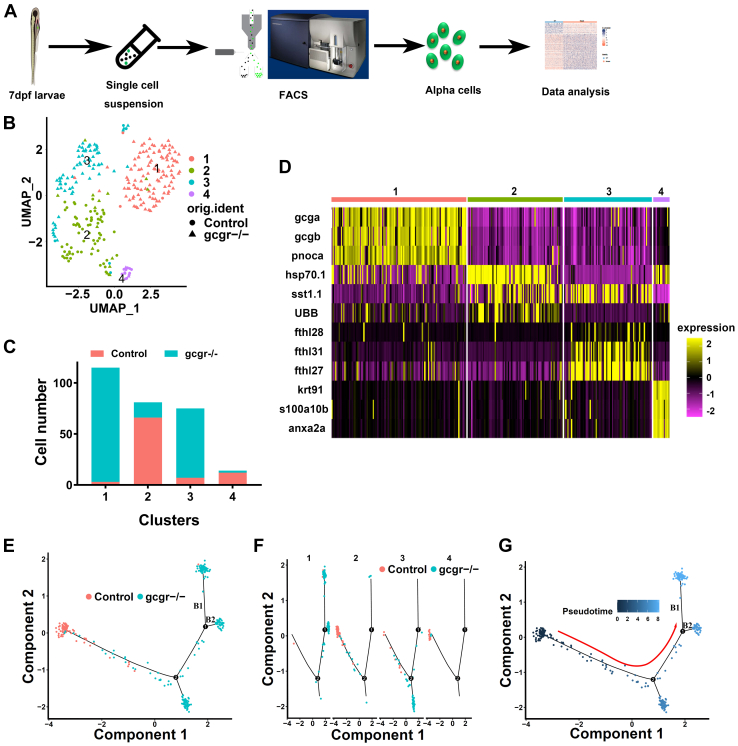
Figure 1
The single-cell transcriptomic overview of αcells from gcgr−/−and control zebrafish.A, schematic of single-cell isolation and single-cell RNA-seq from the zebrafish reporter line Tg (gcga:GFP). B, distribution of all α cells by uniform manifold approximation and projection for dimension reduction (UMAP) analysis. All cells were segregated into four clusters, each cluster was labeled using different colors, the circles and triangles indicate α-cells from control and gcgr−/−, respectively. C. the cell numbers of each cluster 1 to 4 are shown. D, the heatmap shows the top 3 markers in each cluster; the color scale ranges from magenta to yellow corresponding to the gene expression as indicated. E–G, the pseudotime trajectory analysis of control and gcgr−/− mutant α-cells. E, trajectory colored by samples of control or gcgr−/−. F, trajectory colored by individual clusters. G, trajectory colored by pseudotime, and the color in each cell depends on the pseudotime value ranging from 0 to 8. All plots for pseudotime trajectory are based on cell distribution as shown in Fig. 1E. All cells from control and gcgr−/− mutant were aligned in pseudotime trajectory by monocle v2.16.0, number 1 and 2 presented decision point 1 and point 2; B1 and B2 presented branch 1 and branch 2.