
Figure 5
- ID
- ZDB-IMAGE-221214-229
- Publication
- Kang et al., 2022 - Disruption of the glucagon receptor increases glucagon expression beyond α-cell hyperplasia in zebrafish
- All Figures
- Figures for Kang et al., 2022
|
Figure 5
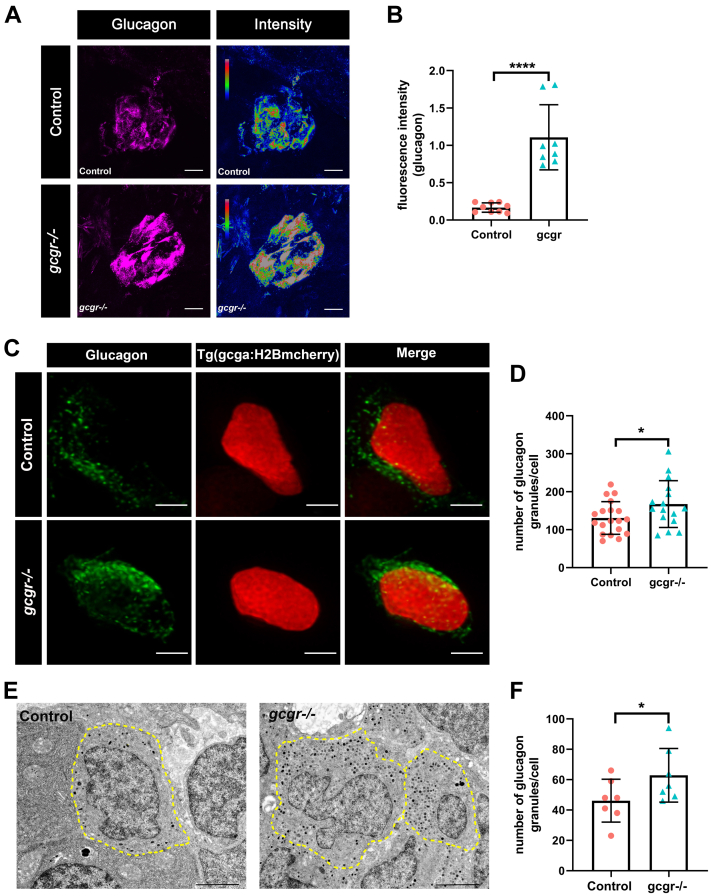
gcgr−/−zebrafish increase glucagon granules and glucagon level.A, representative images of the fluorescence (magenta) and intensity (rainbow) of α-cells from control and gcgr−/− zebrafish, which are indicated by immunostaining with antiglucagon antibody; the scale bar represents 10um. B, quantification of fluorescence intensity of the images from control and gcgr−/− zebrafish. Data represent mean ± SD with significance determined by unpaired two-tailed t test, ∗∗∗∗p < 0.0001. The number of larvae (n) = 8 to 9. C, representative images of α-cells in Tg(gcga:H2BmCherry) and gcgr−/−;Tg(gcga:H2BmCherry) larvae, immunostained with antiglucagon antibody. Green staining indicates intracellular glucagon granules; mCherry protein shown as red labels the nucleus of α cells. The scale bar represent 2 μm. D, quantification of the glucagon granules content per cell from immunostained Tg(gcga:H2BmCherry) and gcgr−/−;Tg(gcga:H2BmCherry) zebrafish. Data represent mean ± SD with significance determined by unpaired two-tailed t test, ∗ p< 0.05, n =16 to 19 cells. E, electron micrographs of control and gcgr−/− zebrafish. The cell boundary is depicted by dotted lines, and the glucagon granules are as gray and black dots in the cells. F, quantification of the glucagon granules content of control and gcgr−/− from transmission electron microscopy (TEM). The scale bar represents 2 μm. Data represent mean ± SD with significance determined by unpaired two-tailed t test, ∗ p< 0.05, n = 15 to 18 cells.