
|
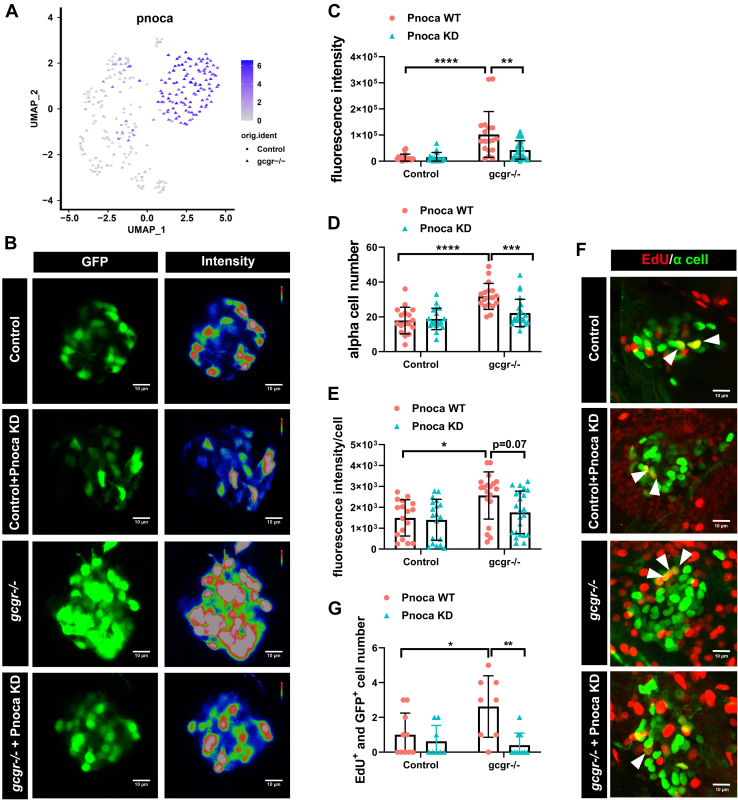
Figure 6
Knockdown of pnoca reduces α-cell number and glucagon expression in the gcgr−/−zebrafish group.A, the plots show the expression of pnoca gene, all plots are based on cell clusters shown in Fig. 1B. B, representative images of the fluorescence intensity of α cells from Tg(gcga:GFP)(control), pnoca knockdown (pnoca KD) Tg(gcga:GFP), gcgr−/−;Tg(gcga:GFP), and pnoca knockdown gcgr−/−;Tg(gcga:GFP) zebrafish in their respective groups. C–E, quantification of the islet fluorescence intensity (C) α-cell number (D) and fluorescence intensity in per cell (E) from control, gcgr−/−, and pnoca knockdown in the respective group. Data represent mean ± SD with significance determined by two-way ANOVA, ∗ p< 0.05; ∗∗ p< 0.01, ∗∗∗ p< 0.001, ∗∗∗∗ p < 0.0001, n =17 to 23. ANOVA results for 6C: interaction: F (1, 73) = 7.829, p = 0.0066; Row factor (control versus gcgr−/−): F (1, 73) = 27.97, p = 0.0001; Column factor (pnoca knockdown): F (1, 73) = 6.847, p = 0.0108. ANOVA results for 6D: interaction: F (1, 73) = 9.566, p = 0.0028; Row factor (control versus gcgr−/−): F (1, 73) = 26.31, p = 0.0001; Column factor (pnoca knockdown): F (1, 73) = 6.523, p = 0.0127. ANOVA results for 6E: interaction: F (1, 74) = 2.425, p = 0.1237; Row factor (control versus gcgr−/−): F (1, 74) = 9.723, p = 0.0026; Column factor (pnoca knockdown): F (1, 74) = 3.856, p = 0.0533. F–G, the representative EdU staining images (F) and quantification (G) of Tg(gcga:GFP)(control), pnoca knockdown (pnoca KD) Tg(gcga:GFP), gcgr−/−;Tg(gcga:GFP), and pnoca knockdown gcgr−/−;Tg(gcga:GFP) zebrafish. GFP+ and EdU+ cells represent the proliferative α cells, which are indicated by arrows. G, data represent mean ± SD with significance determined by two-way ANOVA ∗ p < 0.05; ∗∗ p < 0.01, n=8 to 10. ANOVA results for 6G: interaction: F (1, 32) = 5.274, p = 0.0283; Row factor (control versus gcgr−/−): F (1, 32) = 3.020, p = 0.0919; Column factor (pnoca knockdown): F (1, 32) = 10.42, p = 0.0029.