
- Title
-
NCS1 overexpression restored mitochondrial activity and behavioral alterations in a zebrafish model of Wolfram syndrome
- Authors
- Crouzier, L., Richard, E.M., Diez, C., Denus, M., Peyrel, A., Alzaeem, H., Cubedo, N., Delaunay, T., Maurice, T., Delprat, B.
- Source
- Full text @ Mol Ther Methods Clin Dev
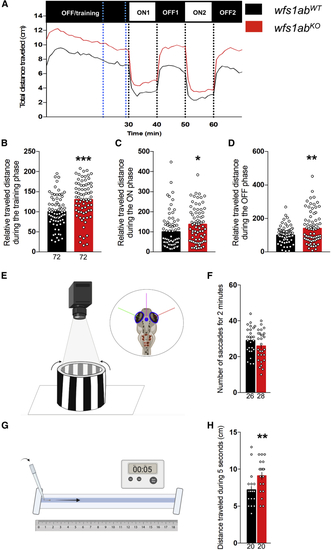
Behavioral analyses of 5 dpf wfs1abKO zebrafish line (A) Analysis of the relative distance traveled by 5 dpf wfs1abKO larvae during the light/dark sequence in the VMR test: training is a light OFF period of 30 min, followed by two light ON and light OFF periods of 10 min each. (B) The training phase over a 10-min period shown by blue dotted lines in (A); (C) the ON phases, averaged for ON1 and ON2; (D) the OFF phases, averaged for OFF1 and OFF2. (E) Illustration of the OKR assay. Four larvae are immobilized in a Petri dish and placed in an arena with rolling black-and-white strips. (F) Number of saccades within 2 min. (G) Illustration of the touch-escape response test. The tail of the larva is touched with a tip and (H) the traveled distance in the rail is measured for 5 s, repeated three times and averaged. Relative distances were expressed as percent of controls. Data show mean ± SEM, calculated from three replicas. The number of animals is indicated within the columns, n = 72 animals per genotype. ∗p < 0.05, ∗∗p < 0.01, ∗∗∗p < 0.0001; unpaired t test. PHENOTYPE:
|
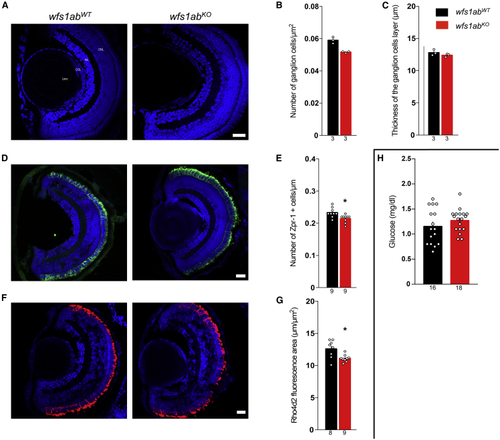
Morphological characterization of the retina and glycemia analysis of the wfs1abKO zebrafish line (A) Typical micrographs of the retina, (B) quantification of the number of ganglion cells, and (C) quantification of the thickness of the associated layer. Confocal images were obtained from sections from wfs1abWT and wfs1abKO zebrafish retina, showing cell nuclei labeled with 4′,6-diamidino-2-phenylindole (DAPI) (blue). (D and E) (D) Typical micrographs of the cones (green) and (E) quantification of photoreceptor cells (red and green cones) labeled with Zpr-1 antibody. (F and G) (F) Typical micrographs of the rods (red) and (G) quantification of rods labeled with Rho4d2 antibody. (H) Pancreas characterization with measurement of blood glucose on whole larvae. GCL, ganglion cell layer; INL, inner nuclear layer; ONL, outer nuclear layer. Scale bars, 50 μm in (A, D, and F). The number of animals is indicated in the columns. ∗p < 0.05; unpaired t test. |
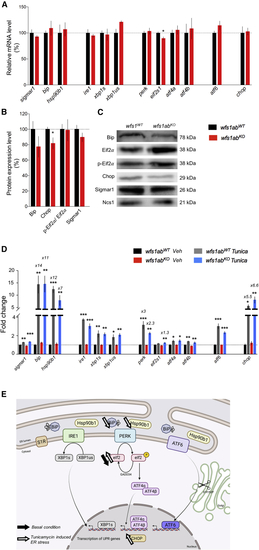
ER stress response in 5 dpf wfs1abKO zebrafish larvae under physiological and ER stress conditions after tunicamycin treatment (A) mRNA levels of ER stress markers were analyzed by qPCR and (B) protein levels by western blot in wfs1abWT and wfs1abKO larvae. (C) Pictures of typical blots (completely stain free) are shown in Figure S4. (D) Larvae were exposed to vehicle DMSO solution (Veh) or tunicamycin 2 μg/mL (Tunica) for 24 h. zeif2α and stain-free were used as a loading control in qPCR and western blot analyses, respectively. The relative expression levels of mRNA after tunicamycin treatment are indicated as the fold change from the respective wfs1abWT/DMSO or wfs1abKO/DMSO control group, when higher than 2-fold. Data are expressed as mean ± SEM, n = 5–9 in each group. ∗p < 0.05 versus wfs1abWT in (A and B). ∗p < 0.05, ∗∗p < 0.01, ∗∗∗p < 0.001 versus DMSO treatment in (A and B) and Tukey’s multiple comparison test in (D). |
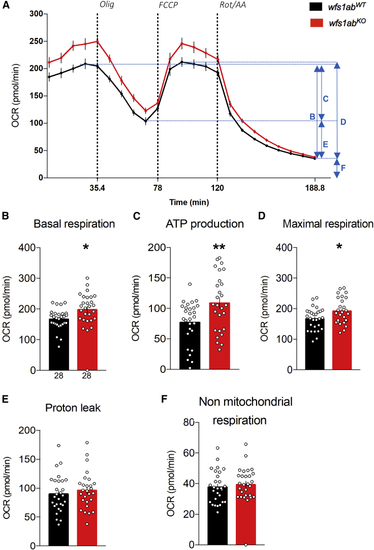
Analysis of mitochondrial respiration in 5 dpf wfs1KO zebrafish larvae (A) Oxygen consumption rate (OCR) profiles of wfs1abWT and wfs1abKO zebrafish larvae at 5 dpf during the assay and calculated, (B) basal respiration rate, (C) ATP production-related OCR, (D) maximal respiration, (E) proton leak, and (F) non-mitochondrial respiration. Data are mean from triplicates and show mean ± SEM from n = 28 animals per genotype. Olig, oligomycin; FCCP, cyanide-p-trifluoromethoxyphenylhydrazone; Rot/AA, rotenone + antimycin A. ∗p < 0.05, ∗∗p < 0.01 versus wfs1abWT, unpaired t test. PHENOTYPE:
|
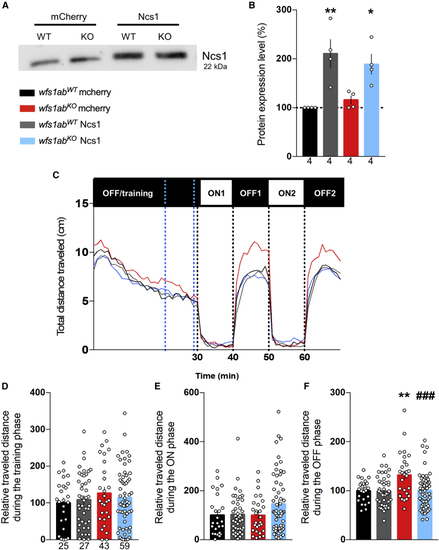
Ncs1 overexpression restores hyperlocomotion in the VMR assay (A and B) The Ncs1 protein level was measured by western blot in mCherry or Ncs1 RNA-injected wfs1abWT and wfs1abKO zebrafish larvae at 5 dpf. (C) Analysis of the distance traveled by mCherry- or Ncs1 RNA-injected wfs1abWT and wfs1abKO larvae, during the light/dark sequence in the VMR assay. Relative distance measured during: (D) the training phase over a 10-min period shown by blue dotted lines in (C); (E) the ON phases, averaged for ON1 and ON2; (F) the OFF phases, averaged for OFF1 and OFF2. Data are mean ± SEM calculated from the number of animals indicated within the columns in (B), n = 4 animals per genotype and (D) for (C–F), n = 25 animals wfs1abWT mCherry, n = 27 animals wfs1abKO mCherry, n = 43 animals wfs1abWT Ncs1, n = 59 animals wfs1abKO Ncs1. ∗p < 0.05, ∗∗p < 0.01 versus wfs1abWT, ##p < 0.01 versus mCherry RNA treatment; Tukey’s multiple comparison test. |
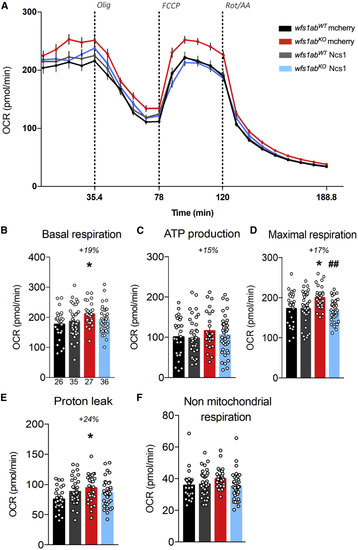
Ncs1 overexpression restores the mitochondrial function (A) OCR in mCherry- or Ncs1 RNA-injected wfs1abWT and wfs1abKO zebrafish larvae at 5 dpf. (B) Basal respiration, (C) ATP production-related OCR, (D) maximal respiration, (E) proton leak, and (F) non-mitochondrial respiration. Data in (A–F) are mean ± SEM calculated from the number of animals indicated below the columns in (B), n = 26 animals wfs1abWT mcherry, n = 35 animals wfs1abKO mcherry, n = 27 animals wfs1abWT Ncs1, n = 36 animals wfs1abKO Ncs1. ∗p < 0.05 versus wfs1abWT, ##p < 0.01 versus mCherry RNA treatment; Tukey’s multiple comparison test. |