
|
Figure 5
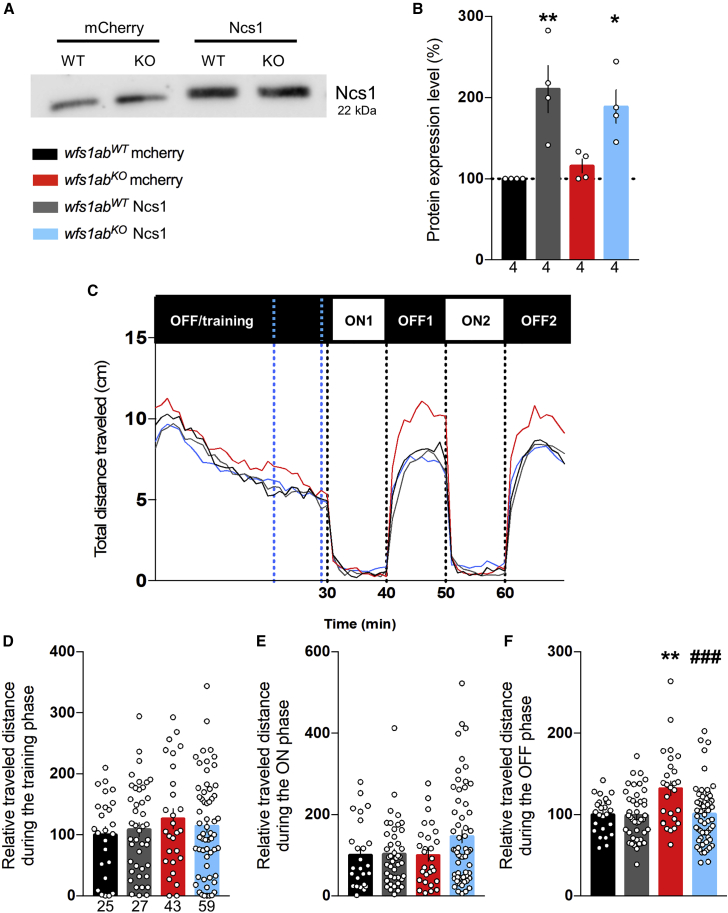
Ncs1 overexpression restores hyperlocomotion in the VMR assay
(A and B) The Ncs1 protein level was measured by western blot in mCherry or Ncs1 RNA-injected wfs1abWT and wfs1abKO zebrafish larvae at 5 dpf. (C) Analysis of the distance traveled by mCherry- or Ncs1 RNA-injected wfs1abWT and wfs1abKO larvae, during the light/dark sequence in the VMR assay. Relative distance measured during: (D) the training phase over a 10-min period shown by blue dotted lines in (C); (E) the ON phases, averaged for ON1 and ON2; (F) the OFF phases, averaged for OFF1 and OFF2. Data are mean ± SEM calculated from the number of animals indicated within the columns in (B), n = 4 animals per genotype and (D) for (C–F), n = 25 animals wfs1abWT mCherry, n = 27 animals wfs1abKO mCherry, n = 43 animals wfs1abWT Ncs1, n = 59 animals wfs1abKO Ncs1. ∗p < 0.05, ∗∗p < 0.01 versus wfs1abWT, ##p < 0.01 versus mCherry RNA treatment; Tukey’s multiple comparison test.