
Figure 3
- ID
- ZDB-FIG-221104-55
- Publication
- Crouzier et al., 2022 - NCS1 overexpression restored mitochondrial activity and behavioral alterations in a zebrafish model of Wolfram syndrome
- Other Figures
- All Figure Page
- Back to All Figure Page
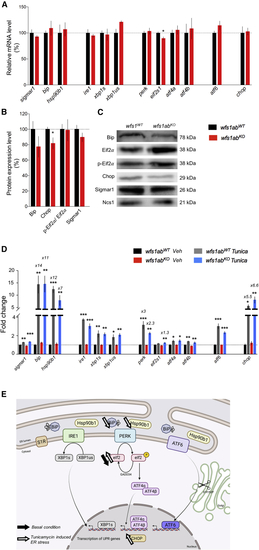
ER stress response in 5 dpf wfs1abKO zebrafish larvae under physiological and ER stress conditions after tunicamycin treatment (A) mRNA levels of ER stress markers were analyzed by qPCR and (B) protein levels by western blot in wfs1abWT and wfs1abKO larvae. (C) Pictures of typical blots (completely stain free) are shown in Figure S4. (D) Larvae were exposed to vehicle DMSO solution (Veh) or tunicamycin 2 μg/mL (Tunica) for 24 h. zeif2α and stain-free were used as a loading control in qPCR and western blot analyses, respectively. The relative expression levels of mRNA after tunicamycin treatment are indicated as the fold change from the respective wfs1abWT/DMSO or wfs1abKO/DMSO control group, when higher than 2-fold. Data are expressed as mean ± SEM, n = 5–9 in each group. ∗p < 0.05 versus wfs1abWT in (A and B). ∗p < 0.05, ∗∗p < 0.01, ∗∗∗p < 0.001 versus DMSO treatment in (A and B) and Tukey’s multiple comparison test in (D). |
| Genes: | |
|---|---|
| Antibodies: | |
| Fish: | |
| Condition: | |
| Anatomical Term: | |
| Stage: | Day 5 |
| Fish: | |
|---|---|
| Condition: | |
| Observed In: | |
| Stage: | Day 5 |