
Figure 1
- ID
- ZDB-FIG-221104-53
- Publication
- Crouzier et al., 2022 - NCS1 overexpression restored mitochondrial activity and behavioral alterations in a zebrafish model of Wolfram syndrome
- Other Figures
- All Figure Page
- Back to All Figure Page
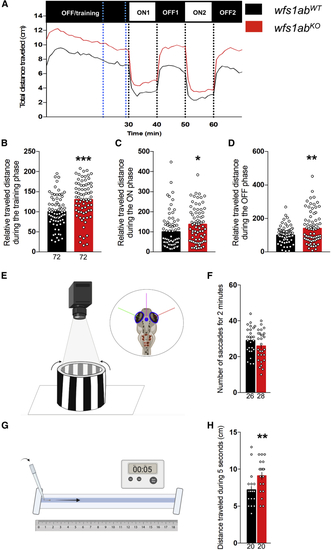
Behavioral analyses of 5 dpf wfs1abKO zebrafish line (A) Analysis of the relative distance traveled by 5 dpf wfs1abKO larvae during the light/dark sequence in the VMR test: training is a light OFF period of 30 min, followed by two light ON and light OFF periods of 10 min each. (B) The training phase over a 10-min period shown by blue dotted lines in (A); (C) the ON phases, averaged for ON1 and ON2; (D) the OFF phases, averaged for OFF1 and OFF2. (E) Illustration of the OKR assay. Four larvae are immobilized in a Petri dish and placed in an arena with rolling black-and-white strips. (F) Number of saccades within 2 min. (G) Illustration of the touch-escape response test. The tail of the larva is touched with a tip and (H) the traveled distance in the rail is measured for 5 s, repeated three times and averaged. Relative distances were expressed as percent of controls. Data show mean ± SEM, calculated from three replicas. The number of animals is indicated within the columns, n = 72 animals per genotype. ∗p < 0.05, ∗∗p < 0.01, ∗∗∗p < 0.0001; unpaired t test. |
| Fish: | |
|---|---|
| Observed In: | |
| Stage: | Day 5 |