
- Title
-
The microbiota promotes social behavior by modulating microglial remodeling of forebrain neurons
- Authors
- Bruckner, J.J., Stednitz, S.J., Grice, M.Z., Zaidan, D., Massaquoi, M.S., Larsch, J., Tallafuss, A., Guillemin, K., Washbourne, P., Eisen, J.S.
- Source
- Full text @ PLoS Biol.
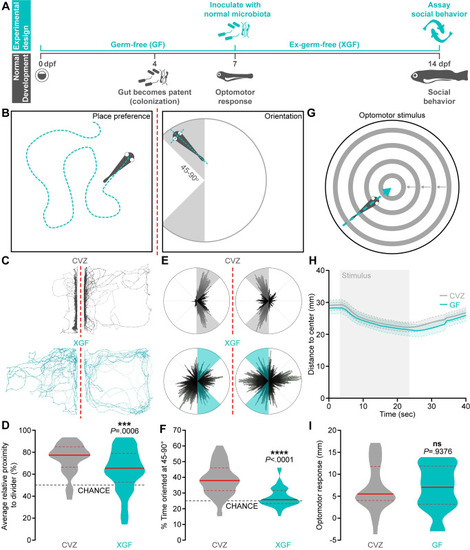
The microbiota promotes zebrafish social behavior.
(A) Experimental design timeline. (B) Zebrafish social behavior is assessed by measuring place preference (left) and body orientation (right) in paired fish separated by a transparent divider (dotted red line). (C-F) Social behavior is reduced in 14 dpf XGF larvae relative to CVZ siblings. Traces (C) and 360° body position polar plots (E) of representative CVZ (gray) and XGF (aqua) larvae during social behavior. Average relative proximity to the transparent divider (D) and percent of time oriented at 45–90° (F) are significantly reduced in XGF (n = 67) larvae relative to CVZ controls (n = 54 larvae; Mann–Whitney U test). (G) Sensorimotor integration is assessed by measuring distance traveled in response to a stimulus simulating motion toward the dish center. (H) Average distance to center is similar in 7 dpf CVZ (gray, n = 25) and GF (aqua, n = 20) larvae during and following stimulus presentation (gray bar; solid lines represent mean, dotted lines represent SEM). (I) Distance traveled in response to optomotor stimulus is not significantly reduced in GF larvae relative to CVZ siblings (unpaired t test). ns, not significant; ***, P < .001; ****, P < .0001. Solid red line represents the median; dotted red lines represent the upper and lower quartiles. Data underlying this figure are available on figshare: https://figshare.com/projects/Bruckner_et_al_Data/136756. |
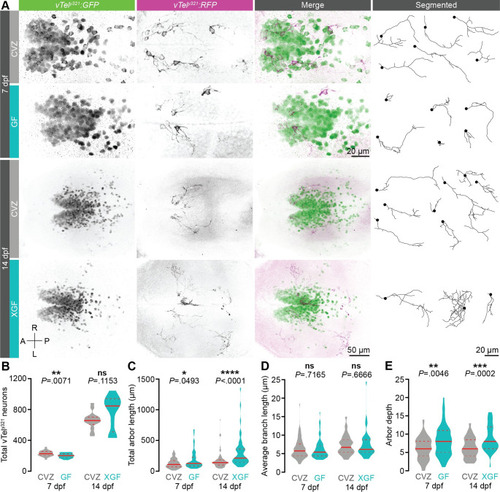
The microbiota restrains vTely321 arborization.
(A) Maximum-intensity projections of vTely321 GFP (green), sparse mosaic vTely321 RFP (magenta), and individually segmented vTely321 neurons from the same representative 7 dpf (top) or 14 dpf (bottom) larvae raised CVZ (gray), GF (aqua), or XGF (aqua). (B) The total number of vTely321 GFP neurons is reduced in 7 dpf GF larvae relative to CVZ controls (n = 24 CVZ and 22 GF larvae; unpaired t test), but not in 14 dpf XGF larvae relative to CVZ controls (n = 14 CVZ and 12 XGF larvae; Mann–Whitney U test). (C-E) Total arbor length (C) and arbor depth (E) are increased and average branch length is unchanged (D) in 7 dpf GF larvae relative to CVZ controls (n = 73 neurons from 24 CVZ larvae and 69 neurons from 25 GF larvae; Mann–Whitney U tests) and in 14 dpf XGF larvae relative to CVZ controls (n = 69 neurons from 14 CVZ larvae and 46 neurons from 13 XGF larvae; Mann–Whitney U tests). ns, not significant; *, P < .05; **, P < .01; ***, P < .001; ****, P < .0001. Solid red line represents the median; dotted red lines represent the upper and lower quartiles. Data underlying this figure are available on figshare: https://figshare.com/projects/Bruckner_et_al_Data/136756. |
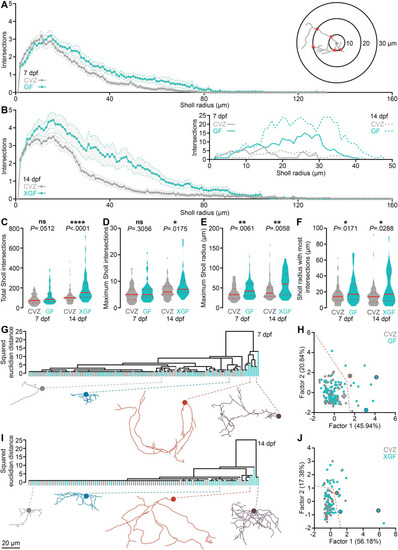
The microbiota reorganizes vTely321 neurite complexity.
(A) Average Sholl profiles (inset) for vTely321 neurons from 7 dpf larvae raised CVZ (gray) or GF (aqua). (B) Average Sholl profiles from 14 dpf larvae raised CVZ (gray) or XGF (aqua), and representative examples (inset). (C-E) Total Sholl intersections across each arbor (C) and maximum Sholl intersections at any radius (D) are not different between vTely321 neurons in 7 dpf CVZ and GF larvae, but are increased in vTely321 neurons in 14 dpf XGF larvae relative to CVZ siblings, whereas maximum Sholl radius (E) and Sholl radius with the most intersections (F) are increased in vTely321 neurons between 7 dpf CVZ and GF larvae and between 14 dpf CVZ and XGF larvae (7 dpf, n = 73 neurons from 24 CVZ larvae, 69 neurons from 25 GF larvae; 14 dpf, n = 69 neurons from 14 CVZ larvae, 46 neurons from 13 XGF larvae; Mann–Whitney U tests). (G-J) vTely321 neurons from 7 dpf (G, H) larvae raised GF (aqua) or CVZ (gray) or 14 dpf (I, J) larvae raised XGF (aqua) or CVZ (gray), grouped by average linkage in hierarchical clustering (G, I) or by factor analysis (H, J; 7 dpf, n = 73 neurons from 24 CVZ larvae, 69 neurons from 25 GF larvae; 14 dpf, n = 69 neurons from 14 CVZ larvae, 46 neurons from 13 XGF larvae). Representative examples are included below each dendrogram and indicated by color in factor analysis plots. Dotted orange lines in (H) and (J) roughly delineate complex and simple neuronal morphologies, which are colored orange in S3 Fig. ns, not significant; *, P < .05; **, P < .01; ****, P < .0001. Solid red line represents the median; dotted red lines represent the upper and lower quartiles. Data underlying this figure are available on figshare: https://figshare.com/projects/Bruckner_et_al_Data/136756. |
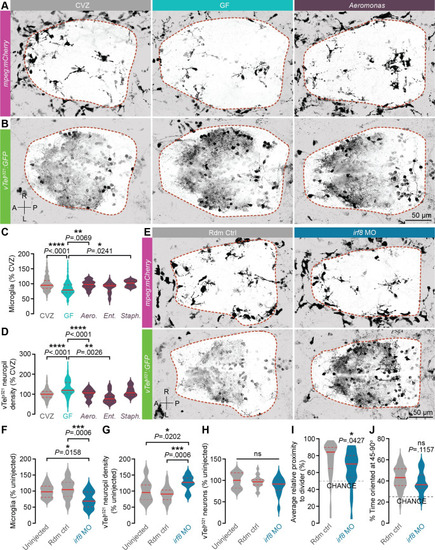
Diverse bacterial strains promote microglial infiltration and restrain vTely321 neurite density.
(A, B) Representative dorsal views of maximum-intensity projections of mpeg1:mCherryTg (A; microglia and macrophages, magenta) and vTely321 GFP (B; neurons, green) from 7 dpf larvae that are CVZ (gray), GF (aqua), or mono-associated with Aeromonas veronii (purple; strain ZOR0001). Dotted lines indicate approximate forebrain boundary, segmented from the corresponding brightfield image. (C) The number of forebrain microglia, normalized to total forebrain volume, is decreased in GF larvae relative to CVZ larvae. This defect is rescued by mono-association with Aeromonas veronii (Aero.; strain ZOR0001) and Staphylococcus sp. (Staph.; strain ZWU0021) (n = 84 CVZ, 92 GF, 23 Aero., 10 Staph., and 11 Ent. larvae; Kruskal–Wallis test with Dunn’s multiple comparisons). (D) vTely321 neuropil density is increased in GF larvae relative to CVZ larvae, and this defect is rescued by mono-association with Aeromonas veronii (Aero.; strain ZOR0001) and Enterobacter cloacae (Ent.; strain ZOR0014) (n = 105 CVZ, 98 GF, 32 Aero., 10 Staph., and 11 Ent. larvae; Brown–Forsythe and Welch ANOVA tests). (E) Dorsal views of maximum-intensity projections of vTely321 GFP (neurons, green) and mpeg1:mCherryTg (microglia and macrophages, magenta) in 7 dpf larvae injected at the 1-cell stage with either random control morpholino (Rdm Ctrl, gray) or irf8 translation-blocking morpholino (irf8 MO, blue). (F) Forebrain microglia, normalized to total forebrain volume, are fewer in irf8 MO larvae relative to uninjected or random control–injected siblings (n = 17 uninjected, 22 random control, and 15 irf8 MO larvae; one-way ANOVA with Tukey’s multiple comparisons test). (G) vTely321 neuropil density is increased in irf8 MO larvae relative to uninjected or random control–injected siblings (n = 17 uninjected, 22 random control, and 15 irf8 MO larvae; one-way ANOVA with Tukey’s multiple comparisons test). (H) The total number of vTely321 neurons is similar in irf8 MO larvae relative to uninjected or random control–injected siblings (n = 17 uninjected, 22 random control, and 15 irf8 MO larvae; one-way ANOVA with Tukey’s multiple comparisons test). (I) Average relative proximity to the transparent divider is significantly reduced in irf8 MO larvae relative to random control–injected siblings (n = 39 random control and 34 irf8 MO larvae; unpaired t test). (J) Percent of time oriented at 45–90° is not significantly different in irf8 MO larvae relative to random control–injected siblings (n = 39 random control and 34 irf8 MO larvae; unpaired t test). ns, not significant; *, P < .05; **, P < .01; ***, P < .001; ****, P < .0001. Solid red line represents the median; dotted red lines represent the upper and lower quartiles. Data underlying this figure are available on figshare: https://figshare.com/projects/Bruckner_et_al_Data/136756. |
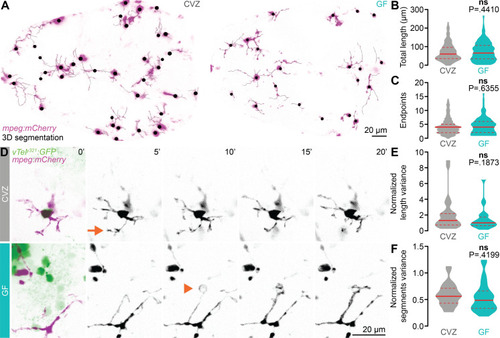
The microbiota does not influence forebrain microglial morphology or dynamics.
(A) Maximum-intensity Z-projections of representative mpeg1:mCherryTg-positive microglia (magenta), segmented in 3D for morphological quantification (black), from CVZ (left) and GF (right) larvae. The mpeg1:mCherryTg channel is masked using a brightfield image to remove macrophages from the analysis. (B, C) Total microglial length (B) and number of endpoints (C) are similar in GF larvae and CVZ siblings (n = 295 microglia from 8 CVZ larvae 204 microglia from 8 GF larvae; Mann–Whitney U tests). (D) Maximum-intensity Z-projections of representative mpeg1:mCherryTg-positive microglia (magenta) and vTely321 neurons (green), from CVZ (gray) and GF (aqua) larvae, every 5 minutes across a 20-minute time series. Arrow indicates a rapidly retracting protrusion, and arrowhead indicates an extending protrusion that likely envelops an unlabeled neuronal soma. (E, F) Mean-normalized length variance (E) and mean-normalized segments variance (F) of vTely321-embedded microglia across the time series are similar in GF larvae and CVZ siblings (n = 28 microglia from 4 CVZ larvae and 28 microglia from 3 GF larvae; unpaired t test for mean-normalized segments variance; Mann–Whitney U test for mean-normalized length variance). Solid lines represent the mean; dotted lines represent SEM. ns, not significant. Solid red line represents the median; dotted red lines represent the upper and lower quartiles. Data underlying this figure are available on figshare: https://figshare.com/projects/Bruckner_et_al_Data/136756. |
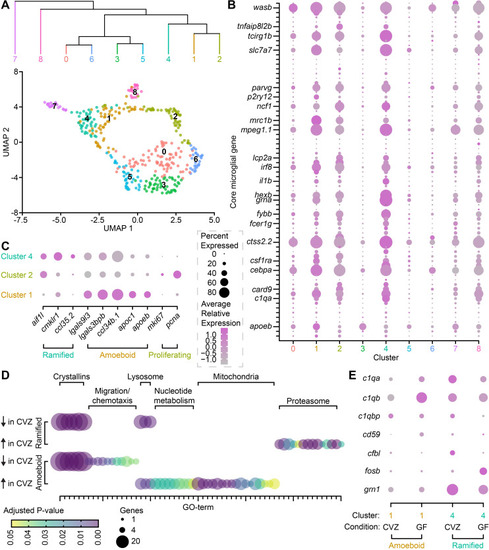
The microbiota influences microglial gene expression.
(A) UMAP visualization and hierarchical clustering of immune cells from mpeg1.1+ Cluster 36 in Massaquoi and colleagues [62]. (B) Average relative expression level (color) and percent of clustered cells (dot size) expressing each member of a 75-gene microglial fingerprint across 9 clusters of mpeg1.1+ Cluster 36 immune cells. Select transcripts are labeled and the complete fingerprint is included in S1 Table. (C) Average relative expression level (color) and percent of clustered cells (dot size) expressing ramified, amoeboid, and proliferative microglial markers in clusters 1, 2, and 4. (D) Number of included genes (dot size) and adjusted P value (color) for gene ontology (GO) terms expressed in ramified microglia (cluster 4, top) and amoeboid microglia (cluster 1, bottom). GO term identities are included in S2 Table. (E). Average relative expression level (color) and percent of amoeboid (cluster 1, orange) or ramified (cluster 4, teal) cells (dot size) from CVZ or GF larvae that express complement pathway transcripts. Data underlying this figure are available on figshare: https://figshare.com/projects/Bruckner_et_al_Data/136756 and in S1–S5 Tables. |
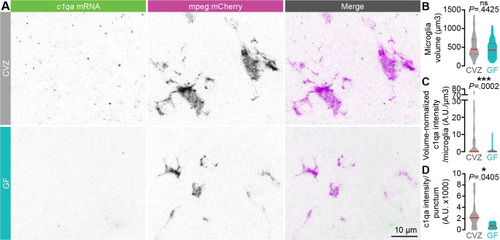
c1q expression is promoted by the microbiota.
(A) Representative maximum intensity projections of fluorescence in situ hybridization against c1qa (green) and antibody labeling against mpeg1:mCherryTg (microglia, magenta) in the forebrain of 7 dpf larvae raised GF or CVZ. (B) Microglial volume is similar in GF and CVZ larvae. (C) c1qa intensity per microglia, normalized by microglial volume, is decreased in microglia in GF larvae relative to microglia in CVZ larvae (n = 36 microglia from 14 CVZ larvae and 51 microglia from 17 GF larvae; Mann–Whitney U tests). Note that c1qa signal was undetectable in some microglia, more often in larvae raised GF than CVZ. (D) c1qa intensity per punctum is decreased in microglia in GF larvae relative to microglia in CVZ larvae (n = 18 c1qa puncta from 14 CVZ larvae and 7 c1qa puncta from 17 GF larvae; Mann–Whitney U test). ns, not significant; *, P < .05; ***, P < .001. Solid red line represents the median; dotted red lines represent the upper and lower quartiles. Data underlying this figure are available on figshare: https://figshare.com/projects/Bruckner_et_al_Data/136756. |