
|
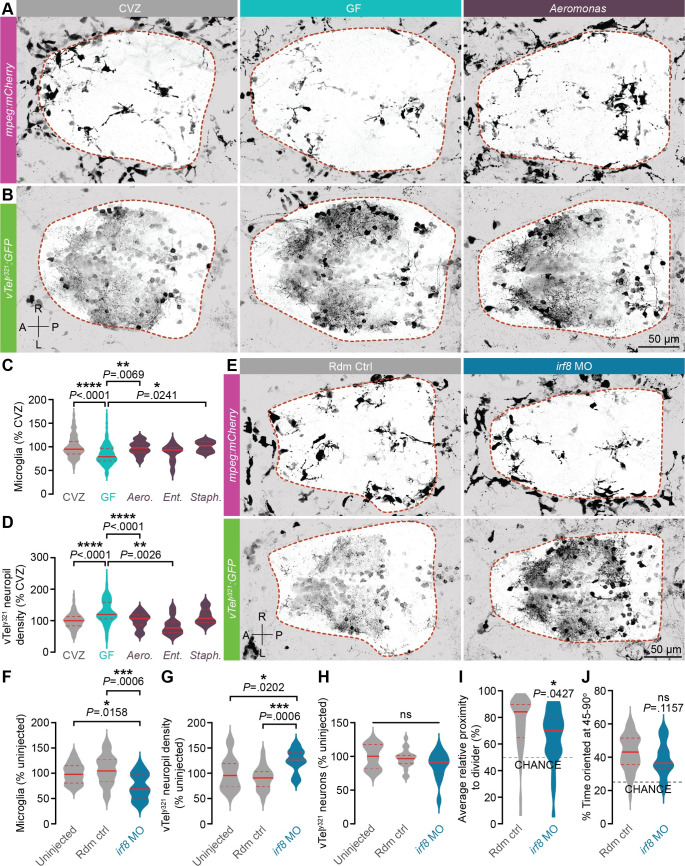
Fig 4
(A, B) Representative dorsal views of maximum-intensity projections of mpeg1:mCherryTg (A; microglia and macrophages, magenta) and vTely321 GFP (B; neurons, green) from 7 dpf larvae that are CVZ (gray), GF (aqua), or mono-associated with Aeromonas veronii (purple; strain ZOR0001). Dotted lines indicate approximate forebrain boundary, segmented from the corresponding brightfield image. (C) The number of forebrain microglia, normalized to total forebrain volume, is decreased in GF larvae relative to CVZ larvae. This defect is rescued by mono-association with Aeromonas veronii (Aero.; strain ZOR0001) and Staphylococcus sp. (Staph.; strain ZWU0021) (n = 84 CVZ, 92 GF, 23 Aero., 10 Staph., and 11 Ent. larvae; Kruskal–Wallis test with Dunn’s multiple comparisons). (D) vTely321 neuropil density is increased in GF larvae relative to CVZ larvae, and this defect is rescued by mono-association with Aeromonas veronii (Aero.; strain ZOR0001) and Enterobacter cloacae (Ent.; strain ZOR0014) (n = 105 CVZ, 98 GF, 32 Aero., 10 Staph., and 11 Ent. larvae; Brown–Forsythe and Welch ANOVA tests). (E) Dorsal views of maximum-intensity projections of vTely321 GFP (neurons, green) and mpeg1:mCherryTg (microglia and macrophages, magenta) in 7 dpf larvae injected at the 1-cell stage with either random control morpholino (Rdm Ctrl, gray) or irf8 translation-blocking morpholino (irf8 MO, blue). (F) Forebrain microglia, normalized to total forebrain volume, are fewer in irf8 MO larvae relative to uninjected or random control–injected siblings (n = 17 uninjected, 22 random control, and 15 irf8 MO larvae; one-way ANOVA with Tukey’s multiple comparisons test). (G) vTely321 neuropil density is increased in irf8 MO larvae relative to uninjected or random control–injected siblings (n = 17 uninjected, 22 random control, and 15 irf8 MO larvae; one-way ANOVA with Tukey’s multiple comparisons test). (H) The total number of vTely321 neurons is similar in irf8 MO larvae relative to uninjected or random control–injected siblings (n = 17 uninjected, 22 random control, and 15 irf8 MO larvae; one-way ANOVA with Tukey’s multiple comparisons test). (I) Average relative proximity to the transparent divider is significantly reduced in irf8 MO larvae relative to random control–injected siblings (n = 39 random control and 34 irf8 MO larvae; unpaired t test). (J) Percent of time oriented at 45–90° is not significantly different in irf8 MO larvae relative to random control–injected siblings (n = 39 random control and 34 irf8 MO larvae; unpaired t test). ns, not significant; *, P < .05; **, P < .01; ***, P < .001; ****, P < .0001. Solid red line represents the median; dotted red lines represent the upper and lower quartiles. Data underlying this figure are available on figshare: https://figshare.com/projects/Bruckner_et_al_Data/136756.