
|
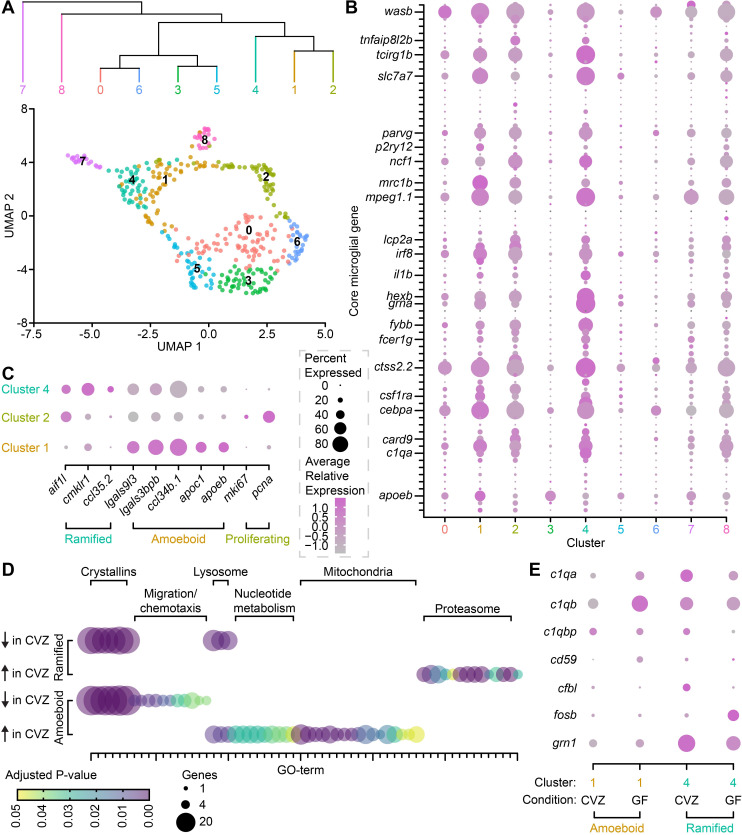
Fig 6
(A) UMAP visualization and hierarchical clustering of immune cells from mpeg1.1+ Cluster 36 in Massaquoi and colleagues [62]. (B) Average relative expression level (color) and percent of clustered cells (dot size) expressing each member of a 75-gene microglial fingerprint across 9 clusters of mpeg1.1+ Cluster 36 immune cells. Select transcripts are labeled and the complete fingerprint is included in S1 Table. (C) Average relative expression level (color) and percent of clustered cells (dot size) expressing ramified, amoeboid, and proliferative microglial markers in clusters 1, 2, and 4. (D) Number of included genes (dot size) and adjusted P value (color) for gene ontology (GO) terms expressed in ramified microglia (cluster 4, top) and amoeboid microglia (cluster 1, bottom). GO term identities are included in S2 Table. (E). Average relative expression level (color) and percent of amoeboid (cluster 1, orange) or ramified (cluster 4, teal) cells (dot size) from CVZ or GF larvae that express complement pathway transcripts. Data underlying this figure are available on figshare: https://figshare.com/projects/Bruckner_et_al_Data/136756 and in S1–S5 Tables.