
|
Fig 1
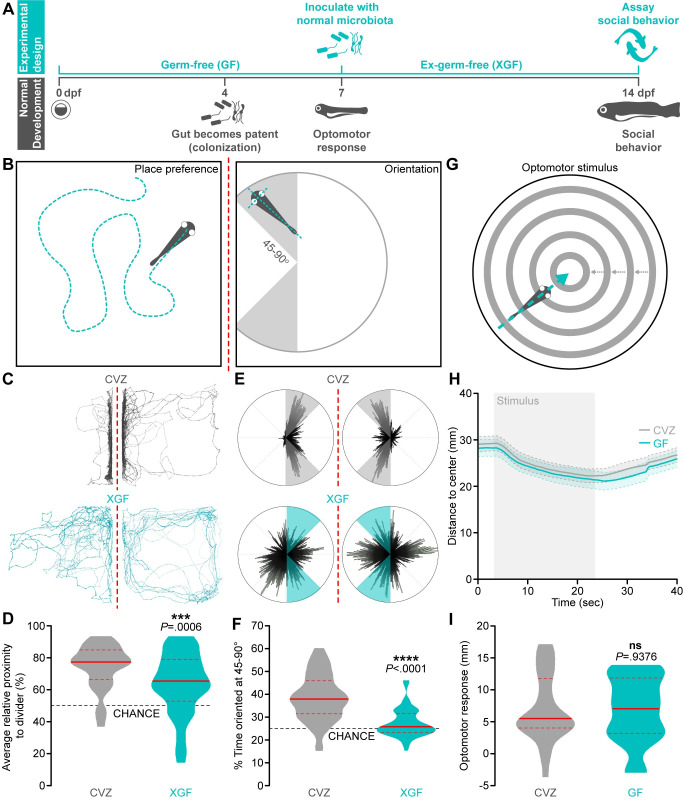
(A) Experimental design timeline. (B) Zebrafish social behavior is assessed by measuring place preference (left) and body orientation (right) in paired fish separated by a transparent divider (dotted red line). (C-F) Social behavior is reduced in 14 dpf XGF larvae relative to CVZ siblings. Traces (C) and 360° body position polar plots (E) of representative CVZ (gray) and XGF (aqua) larvae during social behavior. Average relative proximity to the transparent divider (D) and percent of time oriented at 45–90° (F) are significantly reduced in XGF (n = 67) larvae relative to CVZ controls (n = 54 larvae; Mann–Whitney U test). (G) Sensorimotor integration is assessed by measuring distance traveled in response to a stimulus simulating motion toward the dish center. (H) Average distance to center is similar in 7 dpf CVZ (gray, n = 25) and GF (aqua, n = 20) larvae during and following stimulus presentation (gray bar; solid lines represent mean, dotted lines represent SEM). (I) Distance traveled in response to optomotor stimulus is not significantly reduced in GF larvae relative to CVZ siblings (unpaired t test). ns, not significant; ***, P < .001; ****, P < .0001. Solid red line represents the median; dotted red lines represent the upper and lower quartiles. Data underlying this figure are available on figshare: https://figshare.com/projects/Bruckner_et_al_Data/136756.