
Fig 3
- ID
- ZDB-FIG-221105-11
- Publication
- Bruckner et al., 2022 - The microbiota promotes social behavior by modulating microglial remodeling of forebrain neurons
- Other Figures
- All Figure Page
- Back to All Figure Page
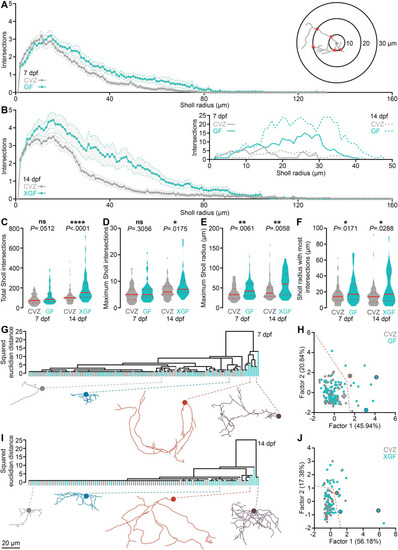
The microbiota reorganizes vTely321 neurite complexity.
(A) Average Sholl profiles (inset) for vTely321 neurons from 7 dpf larvae raised CVZ (gray) or GF (aqua). (B) Average Sholl profiles from 14 dpf larvae raised CVZ (gray) or XGF (aqua), and representative examples (inset). (C-E) Total Sholl intersections across each arbor (C) and maximum Sholl intersections at any radius (D) are not different between vTely321 neurons in 7 dpf CVZ and GF larvae, but are increased in vTely321 neurons in 14 dpf XGF larvae relative to CVZ siblings, whereas maximum Sholl radius (E) and Sholl radius with the most intersections (F) are increased in vTely321 neurons between 7 dpf CVZ and GF larvae and between 14 dpf CVZ and XGF larvae (7 dpf, n = 73 neurons from 24 CVZ larvae, 69 neurons from 25 GF larvae; 14 dpf, n = 69 neurons from 14 CVZ larvae, 46 neurons from 13 XGF larvae; Mann–Whitney U tests). (G-J) vTely321 neurons from 7 dpf (G, H) larvae raised GF (aqua) or CVZ (gray) or 14 dpf (I, J) larvae raised XGF (aqua) or CVZ (gray), grouped by average linkage in hierarchical clustering (G, I) or by factor analysis (H, J; 7 dpf, n = 73 neurons from 24 CVZ larvae, 69 neurons from 25 GF larvae; 14 dpf, n = 69 neurons from 14 CVZ larvae, 46 neurons from 13 XGF larvae). Representative examples are included below each dendrogram and indicated by color in factor analysis plots. Dotted orange lines in (H) and (J) roughly delineate complex and simple neuronal morphologies, which are colored orange in S3 Fig. ns, not significant; *, P < .05; **, P < .01; ****, P < .0001. Solid red line represents the median; dotted red lines represent the upper and lower quartiles. Data underlying this figure are available on figshare: https://figshare.com/projects/Bruckner_et_al_Data/136756. |