
|
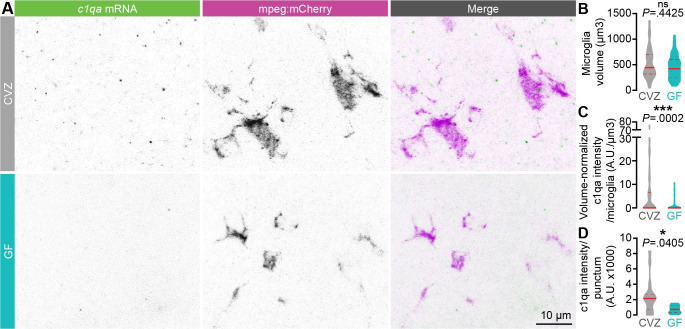
Fig 7
(A) Representative maximum intensity projections of fluorescence in situ hybridization against c1qa (green) and antibody labeling against mpeg1:mCherryTg (microglia, magenta) in the forebrain of 7 dpf larvae raised GF or CVZ. (B) Microglial volume is similar in GF and CVZ larvae. (C) c1qa intensity per microglia, normalized by microglial volume, is decreased in microglia in GF larvae relative to microglia in CVZ larvae (n = 36 microglia from 14 CVZ larvae and 51 microglia from 17 GF larvae; Mann–Whitney U tests). Note that c1qa signal was undetectable in some microglia, more often in larvae raised GF than CVZ. (D) c1qa intensity per punctum is decreased in microglia in GF larvae relative to microglia in CVZ larvae (n = 18 c1qa puncta from 14 CVZ larvae and 7 c1qa puncta from 17 GF larvae; Mann–Whitney U test). ns, not significant; *, P < .05; ***, P < .001. Solid red line represents the median; dotted red lines represent the upper and lower quartiles. Data underlying this figure are available on figshare: https://figshare.com/projects/Bruckner_et_al_Data/136756.