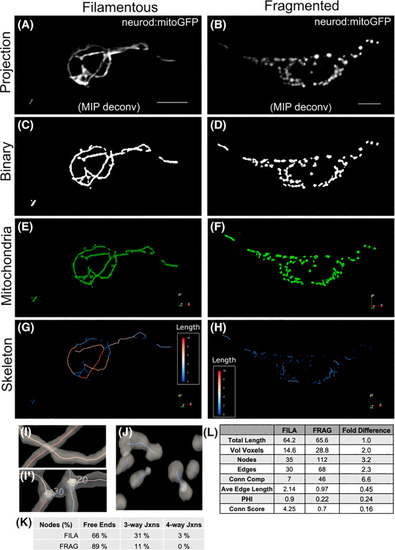
Quantitative analysis of mitoGFP‐labelled mitochondria in secondary islet cells using mitograph. Example cells showing contrasting mitochondria characteristics; filamentous (left) and fragmented (right). (A, B) Maximum intensity projection of neurod:mitoGFP image stacks following deconvolution. Scale bar, 5 μm. (C, D) Binary image following segmentation with mitograph v3.0. Visualisation of mitograph output using Paraview showing mitochondria (E, F) and skeleton (G, H). Skeleton segment lengths (μm) are as indicated by colour scale. (I, J) Close up views of the skeleton as in (G, H), combined with transparent mitochondria. Mitochondrial units that cross in different z‐planes are correctly separated (I) in contrast to mitochondria tubules joining at junctions, which are indicated as numbered nodes (I'). (J, K) The skeleton of fragmented mitochondria shows more free ends and fewer junctions compared to the filamentous network. (L) Comparison of quantitative characteristics (as explained in Materials and Methods) calculated for samples in (A, B). (Conn Comp, connected components; Conn Score, connectivity score; FILA, filamentous; FRAG, fragmented.).

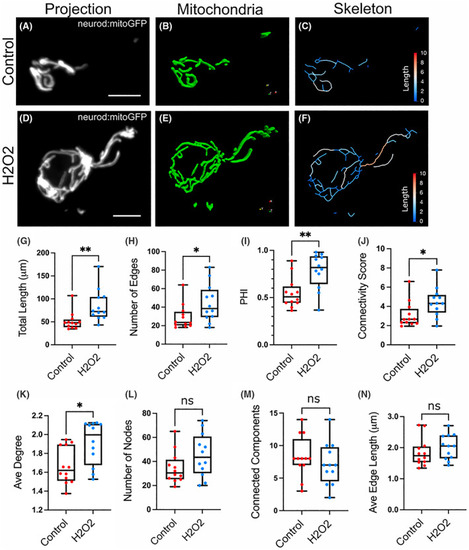
Treatment with H2O2 causes mitochondrial expansion. Representative cells from neuro:mitoGFP larvae at 6 dpf, control (A–C) and H2O2‐treated (D–F). (A, D) Maximum intensity projection of neurod:mitoGFP (grey). Scale bar, 5 μm. Paraview 3D representation of the mitochondrial objects (B, E) and the skeletonised network (C, F) following analysis with mitograph. Skeleton segment lengths (μm) are as indicated by colour scale. (Details of analysis pipeline are in the Methods and Fig. S1.) (G–N) Quantification of mitochondrial parameters in islet cells of control versus H2O2‐treated larvae. Mitochondrial length (G), number of edges (H), PHI (I) Connectivity Score (J) and Average Degree (K) increased with treatment, number of nodes (L), connected components (M) and average edge length (N) did not significantly change with H2O2 treatment. *P < 0.05, **P < 0.01, ns not significant. (Results combined from three independent experiments, control, n = 12; H2O2 treated, n = 12).

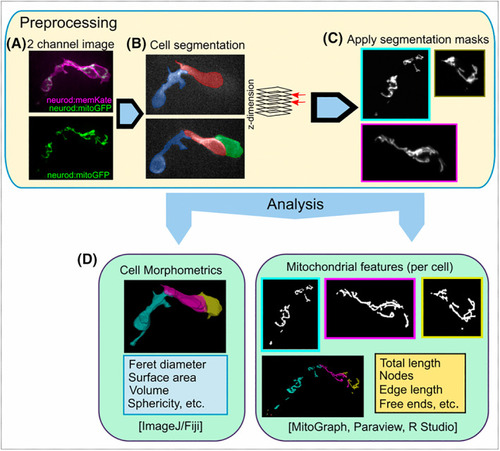
Segmentation of mitochondria in clustering cells. (A) Expression of neurod:memKate in addition to neurod:mitoGFP facilitates segmentation of mitochondria in adjoining cells. Closely opposed mitochondria cannot be assigned to specific cells based on neurod:mitoGFP expression alone (A, bottom). (B) Cell segmentation, shown in two different z‐planes, based on the membrane‐localised memKate signal. (C) By using cell segmentation masks, mitochondria from each cell can be separated. (D) Quantitative analysis of single cell morphology (left) and the corresponding mitochondrial network (right) using open‐source software.

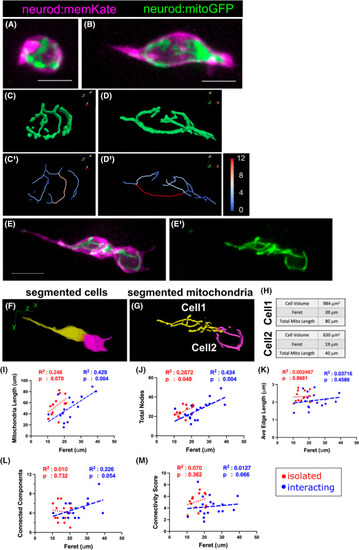
Mitochondrial morphologies of clustering islet cells. (A, B) Maximum intensity projection of image stack of isolated islet cells from neurod:mitoGFP;neurod:memKate transgenics at 7 dpf. Mitochondrial network (C, D) and skeleton (C′, D′) as analysed by mitograph. Skeleton segment lengths (μm) indicated by colour scale. (E–H) Mitochondrial analysis in adjoining cells. (E, E′) Confocal stack projection showing mitochondria (green) with cell boundaries (magenta) (E) and mitochondria alone (E′). (F) Segmentation of adjacent cells, and their corresponding mitochondria (G) based on memKate expression. (H) Calculated values for cell volume, Feret diameter and total mitochondrial length in cells shown in (F, G). (I–M) Linear regression analyses comparing mitochondrial parameters to Feret diameter in isolated (red, as in A, B) versus interacting (blue, as in E) islet cells at 7–8 dpf. Regression lines are shown, with R2 and p values as indicated. Results combined from three independent experiments, isolated cells n = 14; interacting cells n = 15. (A, B, E; Scale bar, 10 μm).

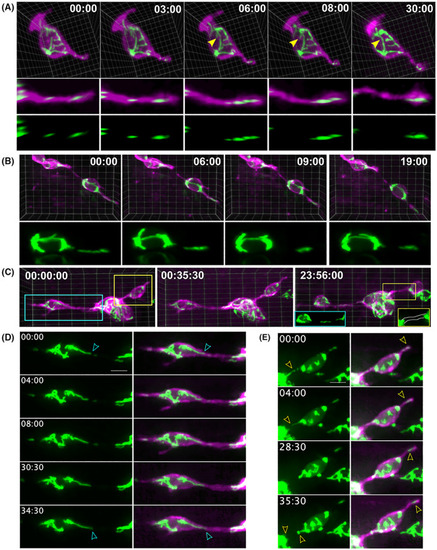
Mitochondrial localisation in relation to cell motility. (A, B) Mitochondria within protrusions move as discrete units (A) or elongated filaments (B). Distally directed mitochondrial displacement over time shown in 3D visualisations of the full cell (A, top), and a rotated view to show the full protrusion length (A, middle), and the mitoGFP signal alone (A, bottom). 3D visualisation of two nearby cells (B) with a filamentous mitochondria shifting distally within a protrusion. (C) 3D view of mitochondria dynamics within clustering cells. When visualised the next day (C, right), the filamentous protrusion has detached from the cell body network (blue inset) and the second cell–cell connection is devoid of mitochondria (yellow inset). (D, E) z‐stack projections highlighting the regions of (A) within the blue box (D) and yellow box (E). (A, B, D, E) Times are as indicated: min : s. (C) Times are as indicated: h : min : s. (D, E) Scale bar, 5 μm.

Acknowledgments
This image is the copyrighted work of the attributed author or publisher, and ZFIN has permission only to display this image to its users. Additional permissions should be obtained from the applicable author or publisher of the image. Full text @ FEBS Lett.