IMAGE

Fig. 1

ID
ZDB-IMAGE-230413-24
Source
Figures for Freudenblum et al., 2022
Image
Figure Caption

Fig. 1

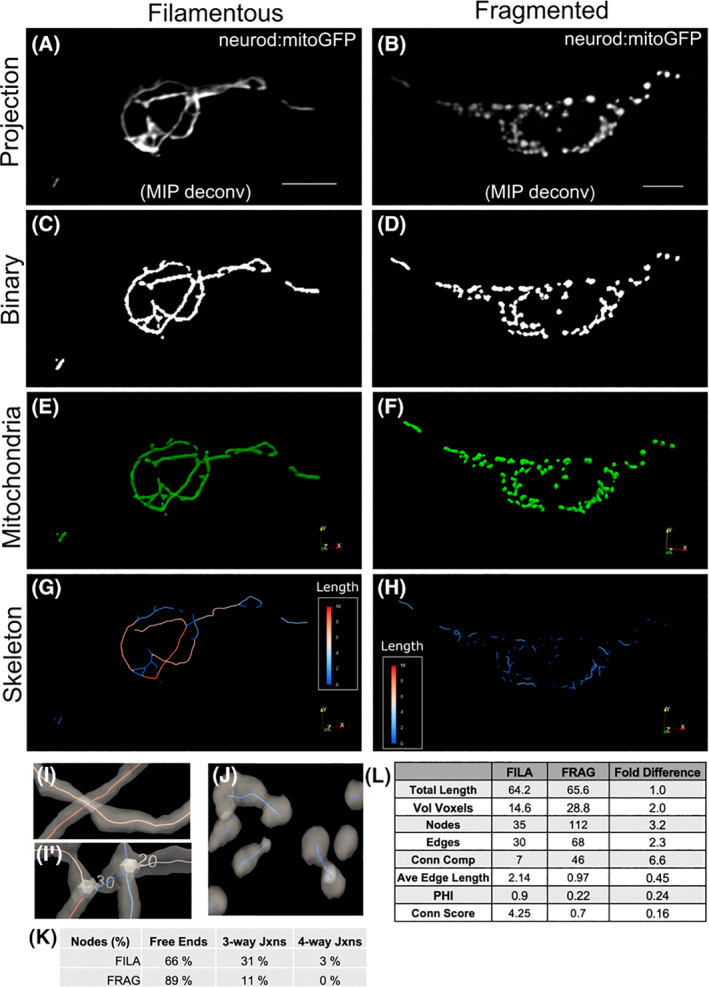
Quantitative analysis of mitoGFP‐labelled mitochondria in secondary islet cells using mitograph. Example cells showing contrasting mitochondria characteristics; filamentous (left) and fragmented (right). (A, B) Maximum intensity projection of neurod:mitoGFP image stacks following deconvolution. Scale bar, 5 μm. (C, D) Binary image following segmentation with mitograph v3.0. Visualisation of mitograph output using Paraview showing mitochondria (E, F) and skeleton (G, H). Skeleton segment lengths (μm) are as indicated by colour scale. (I, J) Close up views of the skeleton as in (G, H), combined with transparent mitochondria. Mitochondrial units that cross in different z‐planes are correctly separated (I) in contrast to mitochondria tubules joining at junctions, which are indicated as numbered nodes (I'). (J, K) The skeleton of fragmented mitochondria shows more free ends and fewer junctions compared to the filamentous network. (L) Comparison of quantitative characteristics (as explained in Materials and Methods) calculated for samples in (A, B). (Conn Comp, connected components; Conn Score, connectivity score; FILA, filamentous; FRAG, fragmented.).

Acknowledgments
This image is the copyrighted work of the attributed author or publisher, and ZFIN has permission only to display this image to its users. Additional permissions should be obtained from the applicable author or publisher of the image. Full text @ FEBS Lett.