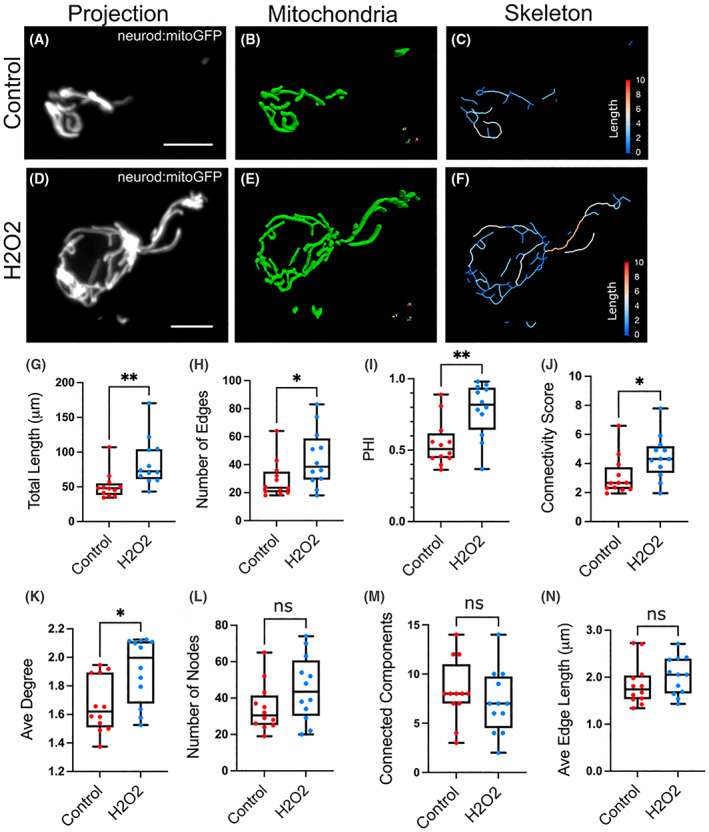
IMAGE

Fig. 2

ID
ZDB-IMAGE-230413-25
Source
Figures for Freudenblum et al., 2022
Image
Figure Caption

Fig. 2

Treatment with H2O2 causes mitochondrial expansion. Representative cells from neuro:mitoGFP larvae at 6 dpf, control (A–C) and H2O2‐treated (D–F). (A, D) Maximum intensity projection of neurod:mitoGFP (grey). Scale bar, 5 μm. Paraview 3D representation of the mitochondrial objects (B, E) and the skeletonised network (C, F) following analysis with mitograph. Skeleton segment lengths (μm) are as indicated by colour scale. (Details of analysis pipeline are in the Methods and Fig. S1.) (G–N) Quantification of mitochondrial parameters in islet cells of control versus H2O2‐treated larvae. Mitochondrial length (G), number of edges (H), PHI (I) Connectivity Score (J) and Average Degree (K) increased with treatment, number of nodes (L), connected components (M) and average edge length (N) did not significantly change with H2O2 treatment. *P < 0.05, **P < 0.01, ns not significant. (Results combined from three independent experiments, control, n = 12; H2O2 treated, n = 12).

Acknowledgments
This image is the copyrighted work of the attributed author or publisher, and ZFIN has permission only to display this image to its users. Additional permissions should be obtained from the applicable author or publisher of the image. Full text @ FEBS Lett.