
|
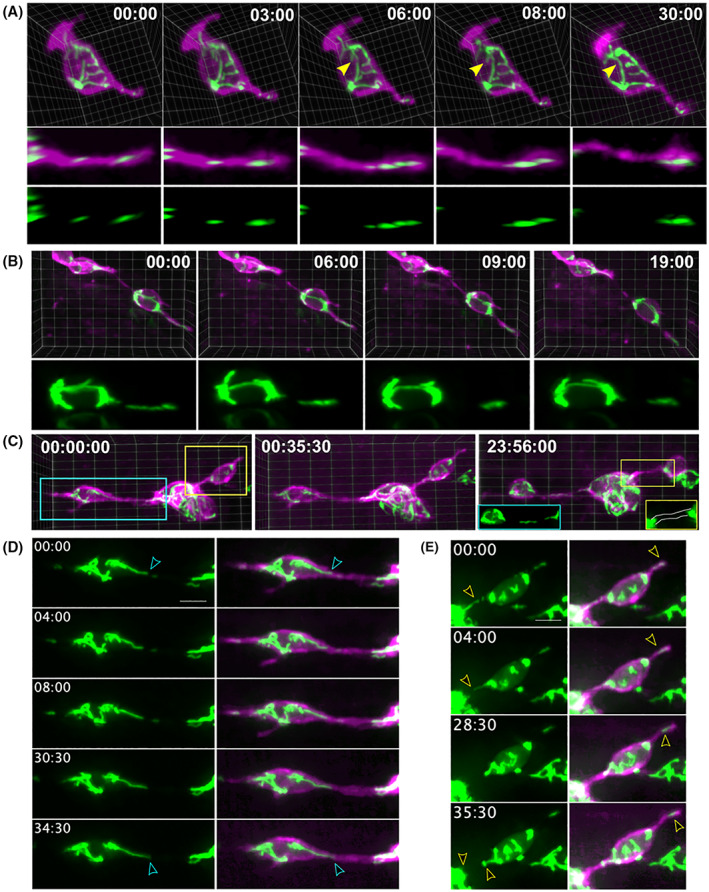
Fig. 5
Mitochondrial localisation in relation to cell motility. (A, B) Mitochondria within protrusions move as discrete units (A) or elongated filaments (B). Distally directed mitochondrial displacement over time shown in 3D visualisations of the full cell (A, top), and a rotated view to show the full protrusion length (A, middle), and the mitoGFP signal alone (A, bottom). 3D visualisation of two nearby cells (B) with a filamentous mitochondria shifting distally within a protrusion. (C) 3D view of mitochondria dynamics within clustering cells. When visualised the next day (C, right), the filamentous protrusion has detached from the cell body network (blue inset) and the second cell–cell connection is devoid of mitochondria (yellow inset). (D, E) z‐stack projections highlighting the regions of (A) within the blue box (D) and yellow box (E). (A, B, D, E) Times are as indicated: min : s. (C) Times are as indicated: h : min : s. (D, E) Scale bar, 5 μm.