FIGURE

Fig. 4

ID
ZDB-FIG-230413-30
Publication
Freudenblum et al., 2022 - Mitochondrial network expansion and dynamic redistribution during islet morphogenesis in zebrafish larvae
Other Figures
All Figure Page
Back to All Figure Page
Fig. 4

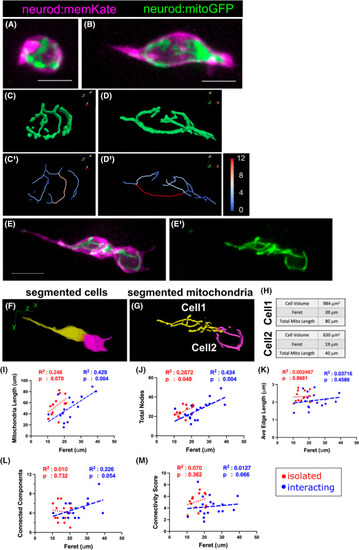
Mitochondrial morphologies of clustering islet cells. (A, B) Maximum intensity projection of image stack of isolated islet cells from neurod:mitoGFP;neurod:memKate transgenics at 7 dpf. Mitochondrial network (C, D) and skeleton (C′, D′) as analysed by mitograph. Skeleton segment lengths (μm) indicated by colour scale. (E–H) Mitochondrial analysis in adjoining cells. (E, E′) Confocal stack projection showing mitochondria (green) with cell boundaries (magenta) (E) and mitochondria alone (E′). (F) Segmentation of adjacent cells, and their corresponding mitochondria (G) based on memKate expression. (H) Calculated values for cell volume, Feret diameter and total mitochondrial length in cells shown in (F, G). (I–M) Linear regression analyses comparing mitochondrial parameters to Feret diameter in isolated (red, as in A, B) versus interacting (blue, as in E) islet cells at 7–8 dpf. Regression lines are shown, with R2 and p values as indicated. Results combined from three independent experiments, isolated cells n = 14; interacting cells n = 15. (A, B, E; Scale bar, 10 μm).

Expression Data

Expression Detail
Antibody Labeling
Phenotype Data

Phenotype Detail
Acknowledgments
This image is the copyrighted work of the attributed author or publisher, and ZFIN has permission only to display this image to its users. Additional permissions should be obtained from the applicable author or publisher of the image. Full text @ FEBS Lett.