FIGURE SUMMARY
Title

Sequential and additive expression of miR-9 precursors control timing of neurogenesis

Authors
Soto, X., Burton, J., Manning, C.S., Minchington, T., Lea, R., Lee, J., Kursawe, J., Rattray, M., Papalopulu, N.
Source
Full text @ Development

Pri-mir-9 paralogues are expressed with different temporal onset. (A) Representative example of chromogenic whole-mount in situ hybridization (WM-ISH) of miR-9 using miR-9 LNA 5′-Dig observed at different stages during development. Similar results can be observed in Soto et al. (2020). Longitudinal view, anterior to the left. Green arrow, forebrain expression; blue arrow, hindbrain expression. (B) Taqman RT-qPCR of mature miR-9 from dissected hindbrain at different stages of development, relative to 25 hpf. Horizontal bars indicate median with 95% confidence intervals. (C) Chromogenic WM-ISH of different pri-mir-9s using specific probes for each paralogue observed at different stages during development. Longitudinal view, anterior to the left. Blue arrowhead, expression in hindbrain at 30-31 hpf; light blue arrowhead, expression in hindbrain at 34-36 hpf; blue arrow, expression in hindbrain at 48 hpf. (D,E) SYBR green RT-qPCR relative quantification of the seven pri-mir-9s from dissected hindbrains at different stages of development. Quantification was normalised using β-actin. Data are mean±s.d. (B,D,E) N=3, each N contains a pool of 10 hindbrains. Scale bars: 200 μm.

Progressive additive expression of pri-mir-9s during development. (A-D) Representative example of double fluorescent WM-ISH (WM-FISH) labelling of pri-mir-9-1/pri-mir-9-4 (A,C) and pri-mir-9-1/pri-mir-9-5 (B,D) in hindbrain (hb) from wild-type embryo observed at 30-32 hpf (A,B) and at 48 hpf (C,D). Transverse view was collected from hindbrain rhombomere 4/5. Longitudinal view was collected from embryos with anterior to the left and posterior to the right; images are maximum intensity projection; 5 μm thickness for 48 hpf embryos and 10 μm thickness for 30-32 hpf embryos. Merged images indicate pri-mir-9-4 or -9-5 in magenta and pri-mir-9-1 in green. White arrows indicate artefactual signal originated from the amplification step with FITC staining in the WM-FISH; red arrowheads indicate rhombomere 1 of the hindbrain. Pri-mir-9-1/pri-mir-9-4: longitudinal/30-32 hpf, N=3; transverse/30-32 hpf, N=3; longitudinal/48 hpf, N=4; transverse/48 hpf, N=8. Pri-mir-9-1/pri-mir-9-5: longitudinal/30-32 hpf, N=3; transverse/30-32 hpf, N=4; longitudinal/48 hpf, N=4; transverse/48 hpf, N=5. (E) Schematic of transverse section from zebrafish hindbrain at the level of the otic vesicle for 30-32 hpf and 48 hpf. A, anterior; MZ, mantle zone; P, posterior; VZ, ventricular zone. Within the VZ there are dorsal progenitors (DP), medial progenitors (MP) and ventral progenitors (VP). Scale bars: 30 µm.

Mature miR-9 expression in a cell is contributed by overlapping activation of distinct miR-9 loci. (A-C) Representative example of transverse view from triple whole-mount smiFISH, labelling active transcriptional sites for pri-mir-9-5, -9-4 and -9-1 (from left to right) combined with cell boundary staining (Phalloidin-Alexa Fluor 488) in hindbrain from wild-type embryo at 30 hpf (A), 36-37 hpf (B) and 48 hpf (C). Merged images show pri-mir-9-5 in magenta, pri-mir-9-4 in yellow, pri-mir-9-1 in cyan and membrane in grey. (A′-C′) Increased magnification of representative images to show single cells expressing any single pri-mir-9 (1 pri-mir-9), any two different pri-mir-9 (2 pri-mir-9) and the three different pri-mir-9 (3 pri-mir-9). (D-F) Percentage of cells expressing any single pri-mir-9 (D), any two different pri-miR-9 (E) and three different pri-mir-9 (F) relative to total number of cells positive for the precursors (30 hpf, N=4; 37-37 hpf, N=4; 48 hpf, N=3). Data are median with 95% confidence interval. Scale bars: 20 µm (A-C); 5 µm (A′-C′).

Concurrent expression of miR-9 precursors in dorsal and medial progenitors. (A-C) Mask representing segmented cells obtained from confocal images in Fig. 3. Using Imaris software, the cell segmentation was performed based on the membrane marker, Phalloidin-AF488, and the spot tool allowed us to count active transcriptional sites for pri-mir-9-5, -9-4 and -9-1. From left to right we visualize the mask showing all segmented cells present in the transverse view of the hindbrain (i, light blue), segmented cells that express pri-mir-9-5 (ii, magenta), both pri-mir-9-5 and -9-4 (iii, light pink) and all three pri-mir-9-5, -9-4 and -9-1 (iv, grey). The study was performed at 30 hpf (A), 36-37 hpf (B) and 48 hpf (C). (D) Schematic of transverse section from zebrafish hindbrain at the level of the otic vesicle for 30-32 hpf, 36-37 hpf and 48 hpf. MZ, mantle zone; VZ, ventricular zone. Within the VZ there are dorsal progenitors (DP), medial progenitors (MP) and ventral progenitors (VP). (E) Representative example of transverse view at 36-37 hpf from triple whole-mount smiFISH labelling neurog1 as ventral progenitor marker (VP, yellow), ascl1 as medial progenitor marker (MP, magenta) and atoh1 as dorsal progenitor marker (DP, cyan). The merge image shows the three progenitor markers in their respective colours, which are expressed in the VZ as described in D. (F) Representative example of transverse view at 36-37 hpf, from triple whole-mount smiFISH labelling pri-mir-9-5 (cyan) and the zebrafish Hes1 orthologues her6 (yellow) and her9 (magenta). The merge image shows pri-mir-9-5 (cyan) co-expressing with her6 (yellow) and her9 (magenta). Dashed line indicates boundary between different progenitor regions (dorsal, medial and ventral progenitor region). Scale bars: 20 µm.

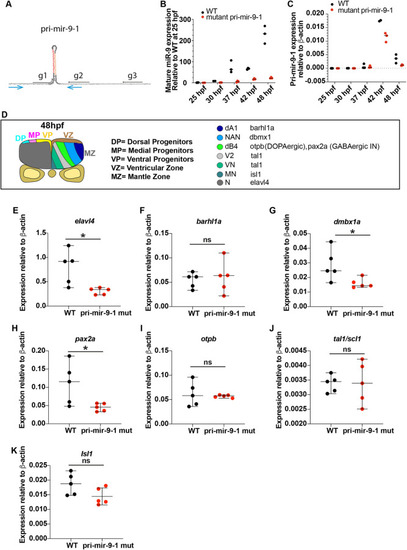
Knocking out the late pri-mir-9-1 preferentially affects neuronal differentiation from medial progenitors. (A) Pri-mir-9-1 hairpin loops with the respective primers used for quantitative PCR annotated as blue arrows (Materials and Methods, mRNA extraction and RT-qPCR; Table S3). Customized guide RNA to delete specifically pri-mir-9-1 are annotated as g1, g2 and g3. Red sequence, miR-9-5′ arm; orange sequence, miR-9-3′ arm; black letters, pre-mir-9; grey sequence, partial sequence of pri-mir-9-1. (B) Taqman RT-qPCR of mature miR-9 from dissected hindbrain at different stages of development, in wild-type conditions (black dots) and deletion of pri-mir-9-1 (red dots), relative to wild-type at 25 hpf. (C) SYBR green RT-qPCR relative quantification of pri-mir-9-1 from dissected hindbrain at different stages of development, in wild-type conditions (black dots) and deletion of pri-mir-9-1 (red dots). Quantification was normalised using β-actin. (D) Schematic of transverse section from zebrafish hindbrain at the level of the otic vesicle at 48 hpf. MZ, mantle zone; VZ, ventricular zone. Within the VZ there are dorsal progenitors (DP), medial progenitors (MP) and ventral progenitors (VP). The schematic shows late neuronal markers expressed in different neuronal cell types in the hindbrain: dA1, dorsal neurons expressing barhl1a; NAN, noradrenergic neurons expressing dbmx1; dB4, GABAergic interneurons expressing pax2a; V2, interneurons expressing tal1; VN, ventral neurons expressing tal1; MN, motor neurons expressing isl1; N, pan neuronal zone expressing elavl4; otpb is localised in the dB4 region but is a marker for dopaminergic neurons. (E-K) SYBR green relative quantification of elavl4 (E), barhl1a (F), dmbx1a (G), pax2a (H), otpb (I), tal1/scl1 (J) and isl1 (K) from dissected hindbrain at 72 hpf, in wild-type conditions (black dots) and deletion of pri-mir-9-1 (red dots). Quantification was normalised using β-actin. Horizontal bars indicate median with 95% confidence intervals. *P<0.05 (Mann-Whitney two-tailed test). (B-C) N=3, each N contain a pool of 10 hindbrain. (E-K) N=5. ns, not significant.

A miR-9 stepwise increase may be required to overcome adaptation of downstream target expression. (A) Graph representing the number of nascent transcription sites for pri-mir-9-1 (yellow), pri-mir-9-4 (magenta) and pri-mir-9-5 (cyan) at 30 hpf, 37-38 hpf and 48 hpf in 25 μm thick transverse sections. 30 hpf, N=4; 37-37 hpf, N=4; 48 hpf, N=3. Data are mean±s.d. (B) Schematic of the extended mathematical model, which combines an incoherent feedforward loop with an additional mutually repressive self-activating downstream target, Y. The parameters αh, αX and αY represent the basal production rates of h, X and Y, respectively. μh, μX and μY represent the degradation rates of h, X and Y, respectively, and βY represents the production rate of Y under self-activation. The hi and pi are Hill coefficients and repression thresholds, respectively, for each of the Hill functions and , and G(x)=1/x. The model is described in detail in the Materials and Methods, Mathematical modelling (subsection Extended model) and specific parameter values are listed in Table S14. (C,D) Dynamics of Her6 in response to different miR-9 expression profiles, for the extended model. (C) A linear miR-9 expression profile leads to a small initial response in Her6 expression levels, which returns to steady state levels owing to the perfect adaptation. (D) Large instantaneous changes in miR-9 can result in a change in steady state for Her6. The initial step change is not sufficient to cause a change in steady state, therefore we introduce a fold change in the stepwise increase of miR-9, which activates Y and represses Her6 into a lower steady state.

Knocking out the late pri-mir-9-1 impairs her6 downregulation over the course of development. (A) Representative example of transverse view from whole-mount smiFISH labelling her6 transcript (yellow) combined with cell boundary staining, Phalloidin-Alexa Fluor 488 (grey), in hindbrain from pri-mir-9-1 homozygote mutant (pri-mir-9-1−/−) (bottom panels) and wild-type (top panels) embryos at 48 hpf. Insets are increased magnification from representative images from boxed area. The images are maximum projections of three z-stacks, 1.89 mm. Green arrows indicate regions with high her6 expression levels in pri-mir-9-1−/− mutants. (B) Percentage of cells expressing her6 relative to total number of cells. Pairwise comparison of her6-positive cells; dots indicate mean per experiment from wild-type (two embryos, three embryos, four embryos; three independent experiments) and pri-mir-9-1 homozygote mutant (two embryos, two embryos, three embryos; three independent experiments); *P=0.041 (one-tailed paired t-test). Scale bars: 30 µm.

Acknowledgments
This image is the copyrighted work of the attributed author or publisher, and ZFIN has permission only to display this image to its users. Additional permissions should be obtained from the applicable author or publisher of the image. Full text @ Development