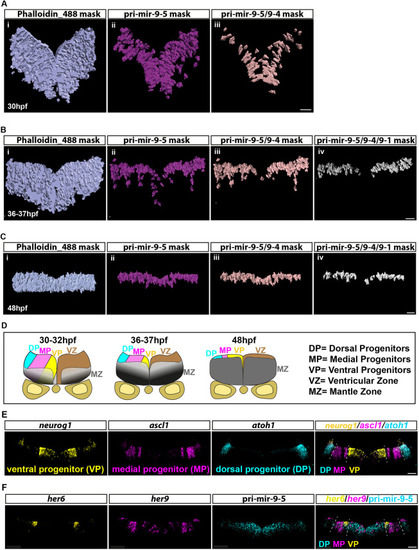
Concurrent expression of miR-9 precursors in dorsal and medial progenitors. (A-C) Mask representing segmented cells obtained from confocal images in Fig. 3. Using Imaris software, the cell segmentation was performed based on the membrane marker, Phalloidin-AF488, and the spot tool allowed us to count active transcriptional sites for pri-mir-9-5, -9-4 and -9-1. From left to right we visualize the mask showing all segmented cells present in the transverse view of the hindbrain (i, light blue), segmented cells that express pri-mir-9-5 (ii, magenta), both pri-mir-9-5 and -9-4 (iii, light pink) and all three pri-mir-9-5, -9-4 and -9-1 (iv, grey). The study was performed at 30 hpf (A), 36-37 hpf (B) and 48 hpf (C). (D) Schematic of transverse section from zebrafish hindbrain at the level of the otic vesicle for 30-32 hpf, 36-37 hpf and 48 hpf. MZ, mantle zone; VZ, ventricular zone. Within the VZ there are dorsal progenitors (DP), medial progenitors (MP) and ventral progenitors (VP). (E) Representative example of transverse view at 36-37 hpf from triple whole-mount smiFISH labelling neurog1 as ventral progenitor marker (VP, yellow), ascl1 as medial progenitor marker (MP, magenta) and atoh1 as dorsal progenitor marker (DP, cyan). The merge image shows the three progenitor markers in their respective colours, which are expressed in the VZ as described in D. (F) Representative example of transverse view at 36-37 hpf, from triple whole-mount smiFISH labelling pri-mir-9-5 (cyan) and the zebrafish Hes1 orthologues her6 (yellow) and her9 (magenta). The merge image shows pri-mir-9-5 (cyan) co-expressing with her6 (yellow) and her9 (magenta). Dashed line indicates boundary between different progenitor regions (dorsal, medial and ventral progenitor region). Scale bars: 20 µm.
|
