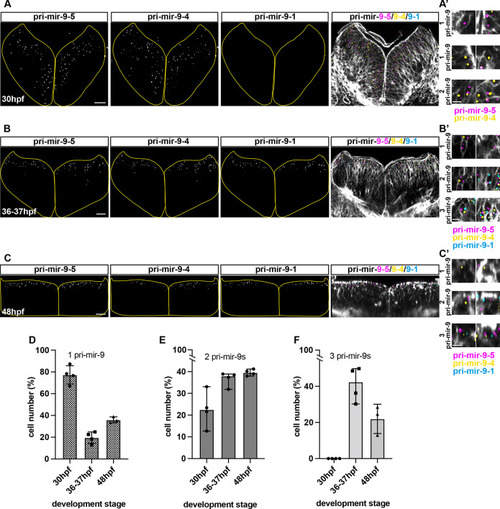
Mature miR-9 expression in a cell is contributed by overlapping activation of distinct miR-9 loci. (A-C) Representative example of transverse view from triple whole-mount smiFISH, labelling active transcriptional sites for pri-mir-9-5, -9-4 and -9-1 (from left to right) combined with cell boundary staining (Phalloidin-Alexa Fluor 488) in hindbrain from wild-type embryo at 30 hpf (A), 36-37 hpf (B) and 48 hpf (C). Merged images show pri-mir-9-5 in magenta, pri-mir-9-4 in yellow, pri-mir-9-1 in cyan and membrane in grey. (A′-C′) Increased magnification of representative images to show single cells expressing any single pri-mir-9 (1 pri-mir-9), any two different pri-mir-9 (2 pri-mir-9) and the three different pri-mir-9 (3 pri-mir-9). (D-F) Percentage of cells expressing any single pri-mir-9 (D), any two different pri-miR-9 (E) and three different pri-mir-9 (F) relative to total number of cells positive for the precursors (30 hpf, N=4; 37-37 hpf, N=4; 48 hpf, N=3). Data are median with 95% confidence interval. Scale bars: 20 µm (A-C); 5 µm (A′-C′).
|
