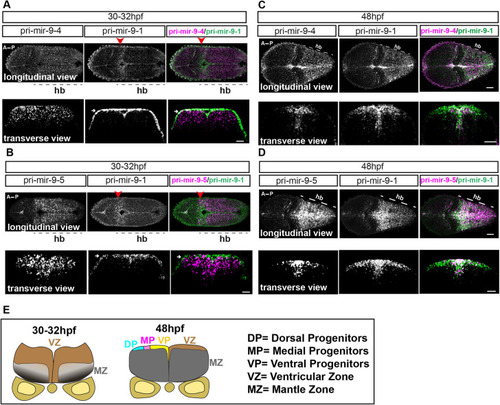
Progressive additive expression of pri-mir-9s during development. (A-D) Representative example of double fluorescent WM-ISH (WM-FISH) labelling of pri-mir-9-1/pri-mir-9-4 (A,C) and pri-mir-9-1/pri-mir-9-5 (B,D) in hindbrain (hb) from wild-type embryo observed at 30-32 hpf (A,B) and at 48 hpf (C,D). Transverse view was collected from hindbrain rhombomere 4/5. Longitudinal view was collected from embryos with anterior to the left and posterior to the right; images are maximum intensity projection; 5 μm thickness for 48 hpf embryos and 10 μm thickness for 30-32 hpf embryos. Merged images indicate pri-mir-9-4 or -9-5 in magenta and pri-mir-9-1 in green. White arrows indicate artefactual signal originated from the amplification step with FITC staining in the WM-FISH; red arrowheads indicate rhombomere 1 of the hindbrain. Pri-mir-9-1/pri-mir-9-4: longitudinal/30-32 hpf, N=3; transverse/30-32 hpf, N=3; longitudinal/48 hpf, N=4; transverse/48 hpf, N=8. Pri-mir-9-1/pri-mir-9-5: longitudinal/30-32 hpf, N=3; transverse/30-32 hpf, N=4; longitudinal/48 hpf, N=4; transverse/48 hpf, N=5. (E) Schematic of transverse section from zebrafish hindbrain at the level of the otic vesicle for 30-32 hpf and 48 hpf. A, anterior; MZ, mantle zone; P, posterior; VZ, ventricular zone. Within the VZ there are dorsal progenitors (DP), medial progenitors (MP) and ventral progenitors (VP). Scale bars: 30 µm.
|
