IMAGE

Fig. 6.

ID
ZDB-IMAGE-230119-21
Source
Figures for Soto et al., 2022
Image
Figure Caption

Fig. 6.

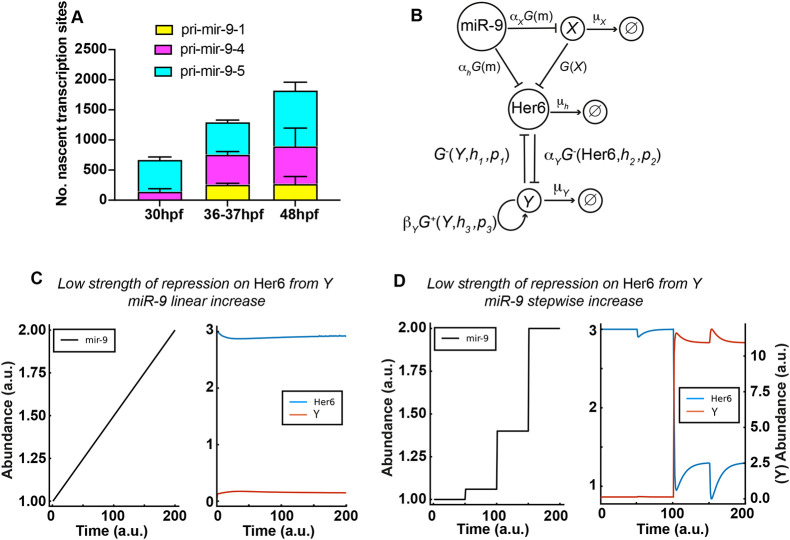
A miR-9 stepwise increase may be required to overcome adaptation of downstream target expression. (A) Graph representing the number of nascent transcription sites for pri-mir-9-1 (yellow), pri-mir-9-4 (magenta) and pri-mir-9-5 (cyan) at 30 hpf, 37-38 hpf and 48 hpf in 25 μm thick transverse sections. 30 hpf, N=4; 37-37 hpf, N=4; 48 hpf, N=3. Data are mean±s.d. (B) Schematic of the extended mathematical model, which combines an incoherent feedforward loop with an additional mutually repressive self-activating downstream target, Y. The parameters αh, αX and αY represent the basal production rates of h, X and Y, respectively. μh, μX and μY represent the degradation rates of h, X and Y, respectively, and βY represents the production rate of Y under self-activation. The hi and pi are Hill coefficients and repression thresholds, respectively, for each of the Hill functions and , and G(x)=1/x. The model is described in detail in the Materials and Methods, Mathematical modelling (subsection Extended model) and specific parameter values are listed in Table S14. (C,D) Dynamics of Her6 in response to different miR-9 expression profiles, for the extended model. (C) A linear miR-9 expression profile leads to a small initial response in Her6 expression levels, which returns to steady state levels owing to the perfect adaptation. (D) Large instantaneous changes in miR-9 can result in a change in steady state for Her6. The initial step change is not sufficient to cause a change in steady state, therefore we introduce a fold change in the stepwise increase of miR-9, which activates Y and represses Her6 into a lower steady state.

Acknowledgments
This image is the copyrighted work of the attributed author or publisher, and ZFIN has permission only to display this image to its users. Additional permissions should be obtained from the applicable author or publisher of the image. Full text @ Development