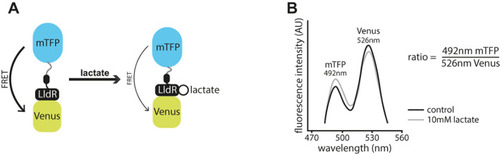
Schematic of the Laconic genetically encoded sensor for lactate. (A) Schematic depiction of the Laconic genetically encoded FRET‐based sensor. A conformational change upon lactate binding to the LldR lactate binding region fused to the Venus chromophore induces a change in energy transfer efficiency from mTFP to Venus (adapted from17 Figure 1B). (B) Graph depicting emission spectra of Laconic. When bound to lactate, fluorescence intensity detected in the range of mTFP increases and that of Venus decreases due to reduced FRET efficiency, thereby increasing the Laconic ratio as calculated by mTFP/Venus (adapted from17).

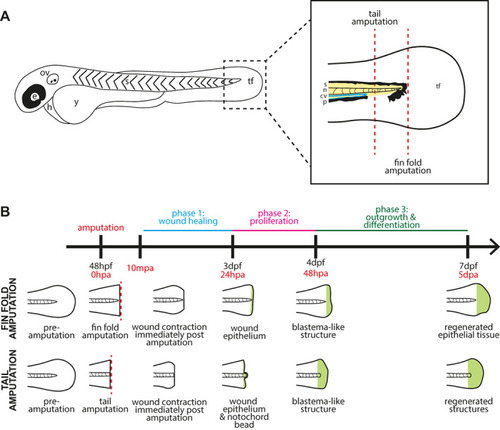
Schematic diagrams of the fin and tail amputation models of zebrafish embryo regeneration. (A) Schematic drawing of a two‐day post fertilisation zebrafish embryo. e: eye, ov: otic vesicle, h: heart, y: yolk, s: somites, tf: tail fin. Dashed box indicates the area shown enlarged in the box to the right, which depicts the tail region with amputation planes for fin fold and tail amputations (dashed red lines). A fin fold amputation site is positioned just distal to the tip of the notochord and excision is limited epithelial tissue and mesenchymal cells, while a tail amputation is oriented using the pigment gap and circulatory loop of the caudal vein, severing notochord, neural tube, and muscle in addition to epithelial tissue. s: somites (yellow), n: notochord (pink), cv: caudal vein (blue), p: pigment (black), tf: tail fin fold. (B) General timeline and schematic illustration of phases of regeneration following amputation. Embryos are imaged at various time points depending on the specific experiment between ten minutes post amputation (10mpa) and full regeneration at five days post amputation (5dpa).

Lactate levels in fin fold regeneration. A) Micrographs of representative Tg[ubb:laconic]lkc1 embryos tails at 48 hpf imaged pre‐amputation and the same individual embryo followed over the course of one‐hour post amputation, pseudocoloured to show Laconic ratio. (B) Micrographs of representative transgenic Tg[ubb:laconic]lkc1 embryos tails amputated at 48 hpf and imaged at given time‐points over the course of regeneration until five days post amputation, pseudocoloured to show Laconic ratio. (C) Graph showing quantification of raw Laconic ratios pre‐treatment and over the course of one‐hour post amputation. Two‐way ANOVA to calculate significance, n = 18. (D) Graph showing fold change between pre‐amputation ratio and 10 min post amputation. Students' t‐test to calculate significance, n = 56. (E) Graphs showing quantification of raw Laconic ratios pre‐treatment and at various timepoints post amputation. Two‐way ANOVA to calculate significance, n = 18. All scale bars represent 200 μm. Differences were considered significant to * P < 0.05, ** P < 0.01, *** P < 0.001, **** P < 0.0001, and ns P ≥ 0.05.

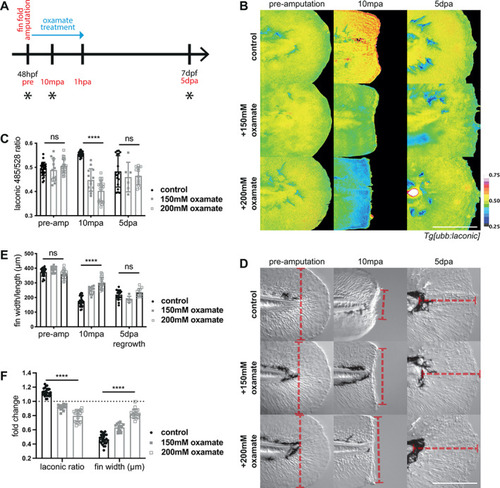
Lactate dehydrogenase inhibition in wound healing. (A) Schematic of the experimental design. Embryos were amputated in the treatment solution and incubated for one hour before washing out the drug, and maintained until regeneration was complete at 120 hpa. Blue arrow indicates period of oxamate treatment and black asterisks indicate time points for imaging. (B) Micrographs of representative Tg[ubb:laconic]lkc1 embryos tails at 48 hpf imaged pre‐amputation, 10 min post amputation with treatment with oxamate or water control, and five‐days post amputation, pseudocoloured to show Laconic ratio. (C) Graph showing quantification of raw Laconic ratios pre‐, 10 min post‐, and five‐days post‐amputation. Two‐way ANOVA to calculate significance, n = 25 (control), n = 13 (150 mM oxamate), n = 19 (200 mM oxamate). (D) DIC micrographs of representative transgenic Tg[ubb:laconic]lkc1 embryos tails as in (B) with examples of measurements (red dashed line) taken for fin width and length quantification. Pre‐amputation and wound width taken to be from edge to edge of the fin fold just distal to the notochord along the amputation plane; regrowth taken from the end of the notochord to the most distal edge of the fin fold, perpendicular to amputation plane. (E) Graph showing measured fin widths/length in micrometres pre‐, 10 min post‐, and five‐days post‐amputation. Fin length measured from the tip of the notochord to the distal edge of the fin fold. Two‐way ANOVA to calculate significance, n = 25 (control), n = 13 (150 mM oxamate), n = 19 (200 mM oxamate). (F) Graph showing fold change (10 mpa value divided by pre‐amputation value) of Laconic ratio and fin width in micrometres in the first 10 min of amputation with treatment with oxamate or water control. Dotted line on the Y axis marks a fold change of 1 (no change). Two‐way ANOVA to calculate significance, n = 25 (control), n = 13 (150 mM oxamate), n = 19 (200 mM oxamate). All scale bars represent 200 μm. Differences were considered significant to * P < 0.05, ** P < 0.01, *** P < 0.001, **** P < 0.0001, and ns P ≥ 0.05.

Effect of lactate dehydrogenase inhibition on actomyosin cable contraction in wound healing. (A) Maximal intensity confocal micrograph projections of representative embryos tails at 48 hpf fixed and stained for phospho‐non muscle myosin light chain II (pNM), Actin, DAPI, and merged, at 10 min post amputation. (B) Graphs showing quantification of fluorescence intensity at the wound border of phalloidin Actin staining and immunofluorescent pNM staining. Inset (i) denotes example of region measured. Two‐way ANOVAs used to calculate significance, ** P < 0.01, **** P < 0.0001, ns P ≥ 0.05, n = 8. All scale bars represent 200 μm.

Mitochondrial inhibition in wound healing. (A) Schematic of the experimental design. Embryos were amputated in the treatment solution and incubated for one‐hour before washing out the drug, and maintained until regeneration was complete at 120 hpa. Green arrow indicates period of sodium azide (NaN3) treatment and black asterisks indicate time points for imaging. (B) Micrographs of representative Tg[ubb:laconic]lkc1 embryos tails treated at 48 hpf for one‐hour post amputation with 15 mM NaN3, to induce prolonged glycolysis and lactate production, or PBS control. Images were acquired at pre‐amputation, 10 min, one‐hour, and five‐days post amputation, and pseudocoloured to show Laconic ratio. (C) Graph showing quantification of raw Laconic ratios pre‐, 10 min post‐, and five‐days post‐amputation. Two‐way ANOVA to calculate significance, n = 12. (D) Graph showing measured fin widths/length in micrometres pre‐, 10 min post‐, and five‐days post‐amputation. Fin length measured from the tip of the notochord to the distal edge of the fin fold. Two‐way ANOVA to calculate significance, n = 12. All scale bars represent 200 μm. Differences were considered significant to * P < 0.05, ** P < 0.01, *** P < 0.001, **** P < 0.0001, and ns P ≥ 0.05.

Lactate levels in tail regeneration. (A) Micrographs of representative Tg[ubb:laconic]lkc1 embryos tails at 48 hpf imaged pre‐amputation and at various time‐points over the course of regeneration (note that images show representative embryos rather than following an individual embryo), pseudocoloured to show Laconic ratio. (B) Graphs showing quantification of raw Laconic ratios pre‐treatment and at various timepoints post amputation. Two‐way ANOVA to calculate significance, n = 24. (C) Graph showing quantification of raw Laconic ratios specifically in the notochord bead region (as indicated in (i)). Students' t‐test to calculate significance, n = 24. Scale bar represents 200 μm. Differences were considered significant to * P < 0.05, ** P < 0.01, *** P < 0.001, **** P < 0.0001, and ns P ≥ 0.05.

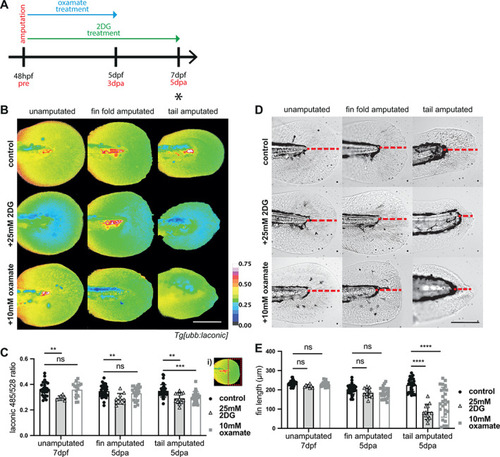
Glycolysis inhibition in regeneration. (A) Schematic of the experimental design. Embryos were amputated and incubated in treatment solution for 72 h or 120 h as indicated by the blue (oxamate) and green (2DG) arrows. Black asterisks indicates time point for imaging, at 5 dpa upon completion of regeneration. (B) Micrographs of representative Tg[ubb:laconic]lkc1 larvae tails, pseudocoloured to show Laconic ratio. Imaged at 7 dpf or 120 hpa when amputated at 48 hpf, treated for the first 72 h post amputation with 25 mM 2DG, for the full 120 h of regeneration with 10 mM oxamate, or with a control. (C) Graph showing quantification of raw Laconic ratios at 7 dpf or 120 hpa when amputated at 48 hpf and treated for the first 72 h post amputation with 25 mM 2DG, 10 mM oxamate, or control. Two‐way ANOVA to calculate significance, n = 13. White dashed box in inset (i) shows example of area measured for quantification of Laconic ratio in (C). (D) Brightfield images of representative Tg[ubb:laconic]lkc1 larvae tails at 7 dpf or 5 dpa when amputated at 48 hpf, treated for the first 72 h post amputation with 25 mM 2DG, for the full 120 h of regeneration with 10 mM oxamate, or with a control. Red dashed line indicates measurement taken for fin length. (E) Graph showing fin length measurements taken at 7 dpf or 120 hpa when amputated at 48 hpf and treated for the first 72 h post amputation with 25 mM 2DG or with a vehicle control. Two‐way ANOVA to calculate significance, n = 13. All scale bars represent 200 μm. Differences were considered significant to * P < 0.05, ** P < 0.01, *** P < 0.001, **** P < 0.0001, and ns P ≥ 0.05.

Acknowledgments
This image is the copyrighted work of the attributed author or publisher, and ZFIN has permission only to display this image to its users. Additional permissions should be obtained from the applicable author or publisher of the image. Full text @ Wound Repair Regen.