
|
FIGURE 5
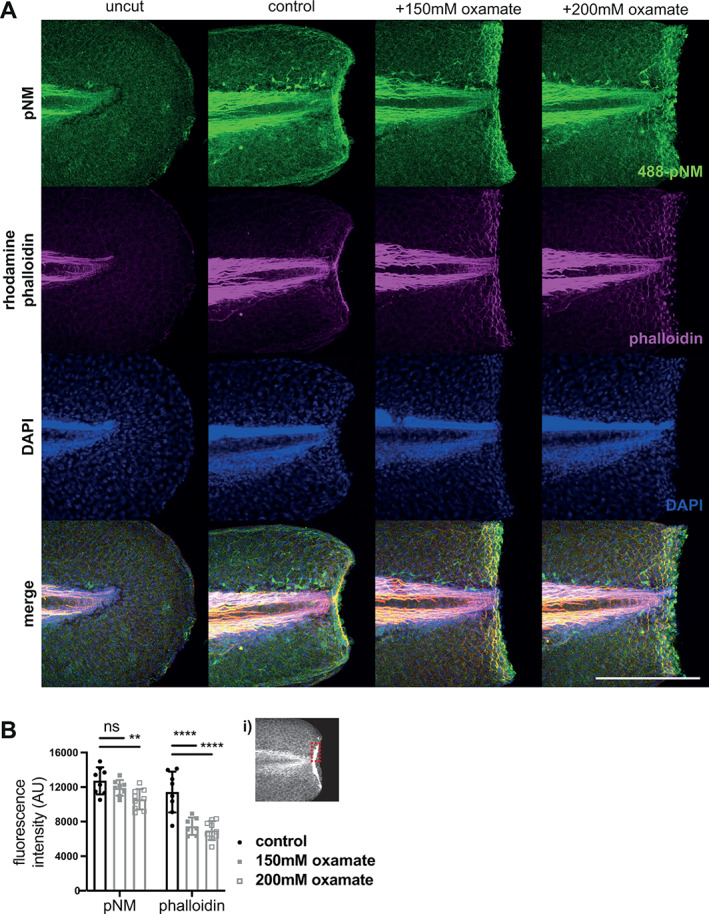
Effect of lactate dehydrogenase inhibition on actomyosin cable contraction in wound healing. (A) Maximal intensity confocal micrograph projections of representative embryos tails at 48 hpf fixed and stained for phospho‐non muscle myosin light chain II (pNM), Actin, DAPI, and merged, at 10 min post amputation. (B) Graphs showing quantification of fluorescence intensity at the wound border of phalloidin Actin staining and immunofluorescent pNM staining. Inset (i) denotes example of region measured. Two‐way ANOVAs used to calculate significance, **