IMAGE

FIGURE 7

ID
ZDB-IMAGE-230110-137
Source
Figures for Scott et al., 2022
Image
Figure Caption

FIGURE 7

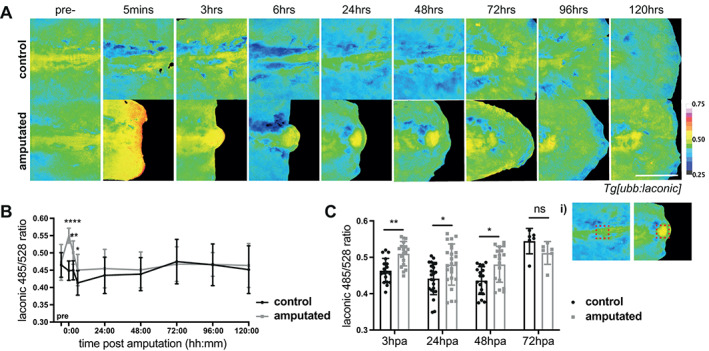
Lactate levels in tail regeneration. (A) Micrographs of representative Tg[ubb:laconic]lkc1 embryos tails at 48 hpf imaged pre‐amputation and at various time‐points over the course of regeneration (note that images show representative embryos rather than following an individual embryo), pseudocoloured to show Laconic ratio. (B) Graphs showing quantification of raw Laconic ratios pre‐treatment and at various timepoints post amputation. Two‐way ANOVA to calculate significance, n = 24. (C) Graph showing quantification of raw Laconic ratios specifically in the notochord bead region (as indicated in (i)). Students' t‐test to calculate significance, n = 24. Scale bar represents 200 μm. Differences were considered significant to * P < 0.05, ** P < 0.01, *** P < 0.001, **** P < 0.0001, and ns P ≥ 0.05.

Acknowledgments
This image is the copyrighted work of the attributed author or publisher, and ZFIN has permission only to display this image to its users. Additional permissions should be obtained from the applicable author or publisher of the image. Full text @ Wound Repair Regen.